ARCHIVED CONTENT
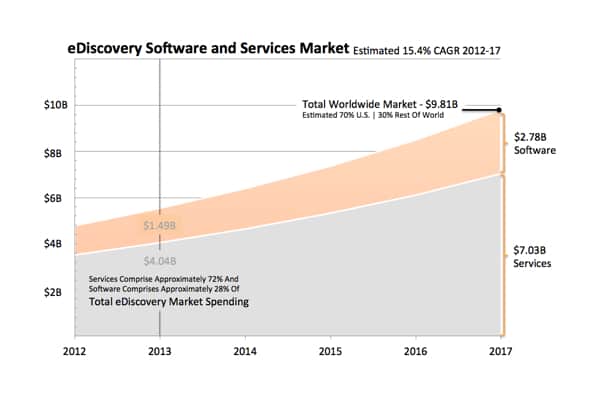
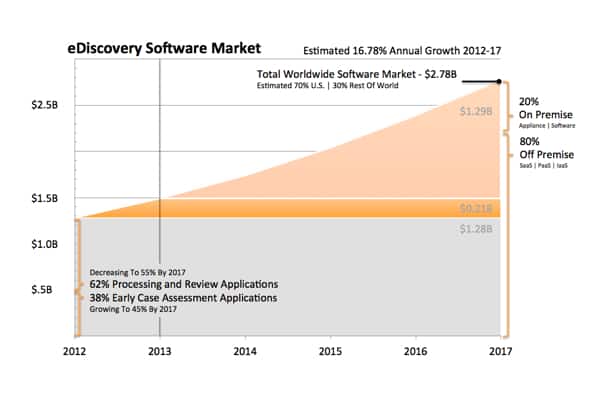
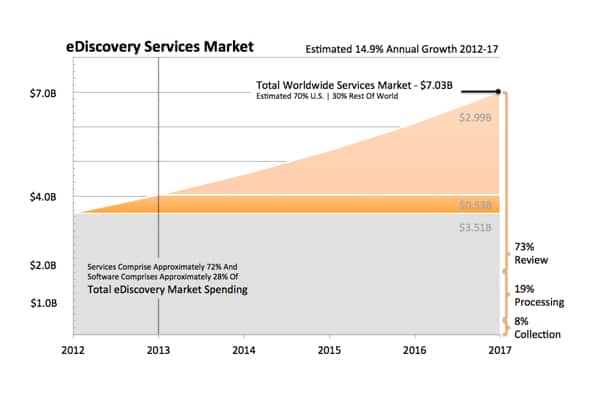
You are viewing ARCHIVED CONTENT released online between 1 April 2010 and 24 August 2018 or content that has been selectively archived and is no longer active. Content in this archive is NOT UPDATED, and links may not function.Taken from a combination* of public market sizing estimations as shared in leading electronic discovery publications, posts and discussions over time, the following eDiscovery Market Size Mashup** shares general market sizing estimates for both the software and service areas of the electronic discovery market for the years between 2012 and 2017.
Provided as mashup images for your consideration are three general views of the eDiscovery market to include a combined market view, a software-centric market view and a service-centric market view. The mashup images represent one interpretation of publicly available market sizing data and are designed to be “general in nature focusing on trends” versus “specific in nature focusing on econometric-like details.”
* Sources for eDiscovery market sizing estimations include but are not limited to:
- Gartner, Inc. “Magic Quadrant for E-Discovery Software.” Debra Logan, Alan Dayley, Sheila Childs. June 10, 2013.
- The Radicati Group. “eDiscovery Market, 2012-2016.” Sara Radicati, Todd Yamasaki. October 2012.
- Transparency Market Research. “World e-Discovery Software & Service Market Study.” August 2012.
- Rand Institute For Civil Justice. “Where the Money Goes: Understanding Litigant Expenditures for Producing Electronic Discovery.” Nicolas Pace and Laura Zakaras. April 2012.
- IDC “MarketScape: Worldwide Standalone Early Case Assessment Applications Vendor Analysis.” Vivian Tero. September 19, 2011.
- Industry Observer Estimations (Multiple Observers)
** The main characteristics of mashups are a combination, visualization, and aggregation. It is important to make existing data more useful, moreover for personal and professional use. (Wikipedia)
