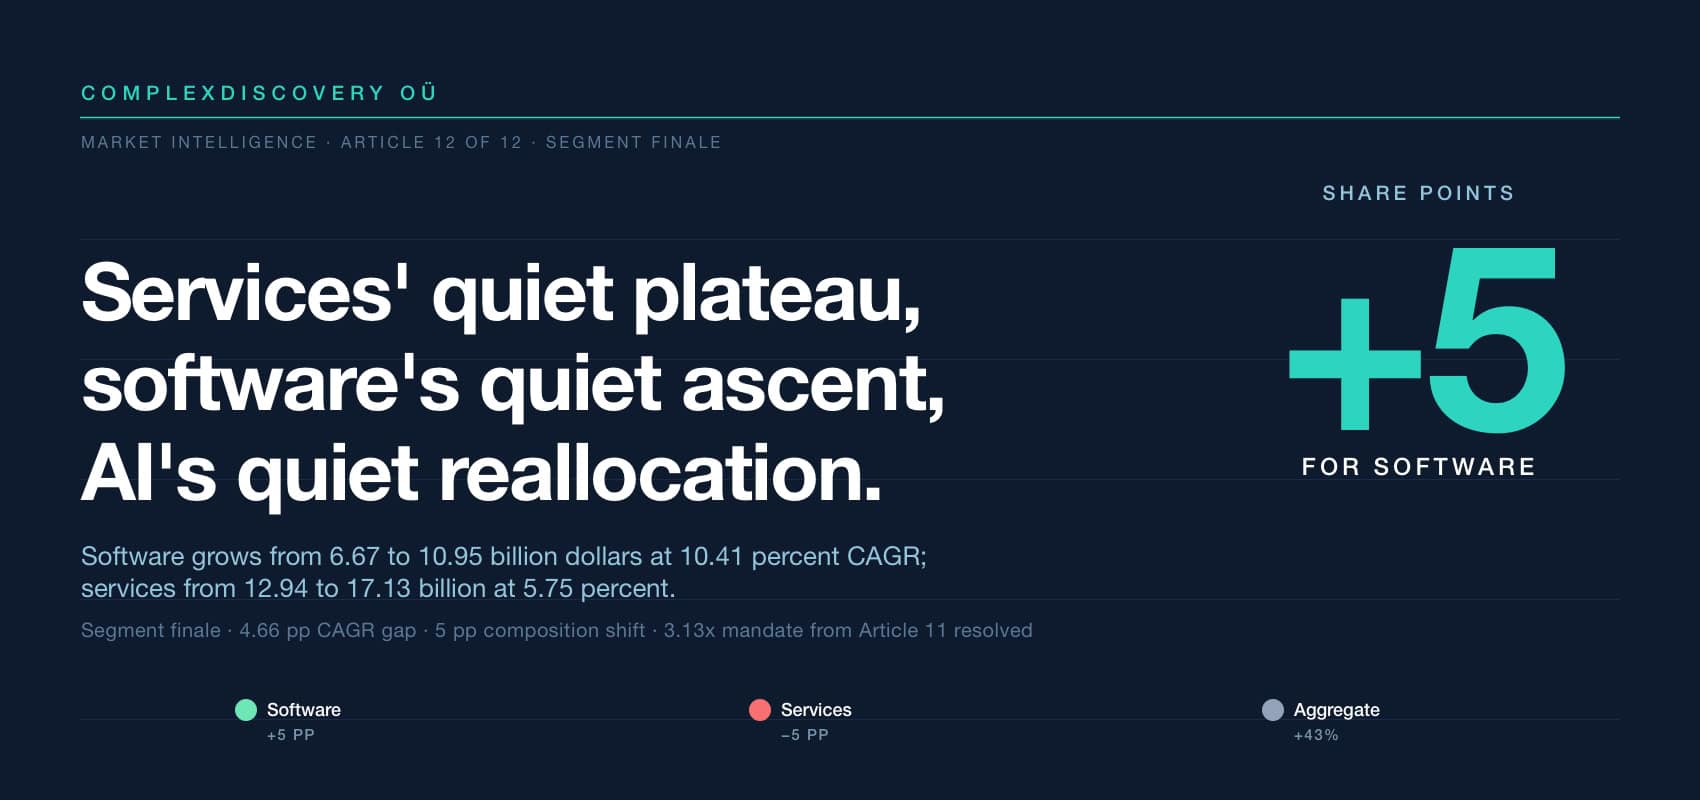
Editor’s Note: The worldwide eDiscovery market reached an estimated 19.61 billion dollars in 2025 and is projected to climb to 28.08 billion dollars by 2030. The aggregate trajectory grows at a reconciled compound annual rate of 7.44 percent. Beneath that aggregate line are two segment trajectories moving at materially different rates: software grows at 10.41 percent, while services grow at 5.75 percent. The 4.66-percentage-point CAGR gap translates into a 5-percentage-point composition shift across the five-year horizon, with software’s share of total worldwide eDiscovery spend rising from 34 percent in 2025 to 39 percent in 2030 and services’ share falling from 66 percent to 61 percent.
The segment view connects directly to the demand-side throughline documented in Article 11 of this series. Global data volume rises from 181 zettabytes in 2025 to 812 zettabytes in 2030 — approximately 35 percent compounded annually — against a market growing at approximately 7.44 percent. The 27.6-percentage-point per-year gap compounds into a 3.13-times productivity-per-dollar mandate by 2030. The software-services synthesis presented here is the segment-level resolution of that mandate. Software absorbs the mandate primarily through capability compounding: AI-assisted review, AI-driven analytics, automated processing, and emerging agentic workflows. Services absorbs the mandate primarily through mix shift, as traditional managed-review revenue compresses while higher-value advisory and specialized-response work expands at premium rates.
For cybersecurity, data privacy, regulatory compliance, and eDiscovery professionals, three observations follow at the close of this series. First, the segment-level CAGR gap appears structural rather than cyclical and is consistent with the AI capability evolution documented across the prior eleven articles. Second, the aggregate eDiscovery market line, while a useful headline, increasingly understates the qualitative changes happening underneath at the segment level; the 7.44 percent aggregate CAGR contains two stories that compound differently. Third, the consolidated 2025-2030 eDiscovery Marketplace Mashup, publishing as the synthesis vehicle for this series, is the citable resource for quantitative claims drawn from the analysis, with the full source list, citation guidance, and methodology disclosure included at that time.
Content Assessment: Market Intelligence: AI reallocates eDiscovery channels - software gains five share points through 2030
Information - 93%
Insight - 93%
Relevance - 92%
Objectivity - 93%
Authority - 94%
93%
Excellent
A short percentage-based assessment of the qualitative benefit expressed as a percentage of positive reception of the recent article from ComplexDiscovery OÜ titled, "Market Intelligence: AI reallocates eDiscovery channels as software gains five share points through 2030."
Industry Research – eDiscovery Market Sizing Beat
Market Intelligence: AI reallocates eDiscovery channels as software gains five share points through 2030
Software at 10.41 percent CAGR, services at 5.75 percent, aggregate at 7.44 percent – the 4.66-percentage-point segment gap that resolves the 3.13x productivity mandate at the highest level of segmentation, closing the Market Intelligence series before the consolidated Mashup
ComplexDiscovery Staff
Eleven articles into the Market Intelligence series, the segment-level view of where worldwide eDiscovery dollars get spent has come into focus. Software deployment, cloud composition, services mix, geography, demand sector, direct delivery, the long-horizon task arc, and the demand-side data volume curve underneath all of it – each has been examined in turn. This twelfth installment closes the segment view by synthesizing the two top-level segments at the highest level – software and services – and traces how the 3.13x productivity-per-dollar mandate established in Article 11 resolves itself across the two channels. The aggregate worldwide eDiscovery market reaches an estimated 19.61 billion dollars in 2025 and a projected 28.08 billion dollars in 2030, a reconciled 7.44 percent compound annual growth rate. But the aggregate line is two segments compounding at materially different rates: software at 10.41 percent, services at 5.75 percent. The 4.66-percentage-point gap between them is, in large measure, where the productivity mandate gets recorded in the financial composition of the industry.
The 2025 baseline: 6.67 billion in software, 12.94 billion in services
In 2025, reconciled estimates place worldwide eDiscovery software spending at approximately 6.67 billion dollars and worldwide services spending at approximately 12.94 billion dollars. Software accounts for 34 percent of the aggregate market; services for 66 percent. The 66-34 services-software split has been the working composition of the worldwide eDiscovery market for the better part of the prior decade, anchored on the services side by managed review, advisory work, forensic collection, and specialized regulatory response – capability categories where human expertise has remained central even as AI tooling has absorbed individual task layers. Software has been the smaller segment in absolute terms but the faster-growing one – and the gap between the two segment CAGRs compounds across the 2025-2030 horizon into a meaningful composition shift.
Chart: eDiscovery Software and Services Market (2025-2030)
eDiscovery Software and Services Market (2025-2030)
The 2030 forecast: 10.95 billion in software, 17.13 billion in services
By 2030, the reconciled forecast places worldwide eDiscovery software spending at approximately 10.95 billion dollars and worldwide services spending at approximately 17.13 billion dollars. Software’s share of the aggregate market rises to 39 percent; services’ share falls to 61 percent. The 5-percentage-point composition shift across five years is gradual in any single year but cumulative across the cycle, and it represents a meaningful directional rebalancing in how worldwide eDiscovery dollars are resourced. Services remains the larger segment by absolute spend through 2030 – the segment crossover point falls outside the 2025-2030 window – but the share gap between the two segments narrows from approximately 32 percentage points in 2025 to roughly 22 percentage points in 2030. The trajectory through the back half of the decade points unambiguously in the same direction.
The 4.66-percentage-point CAGR gap
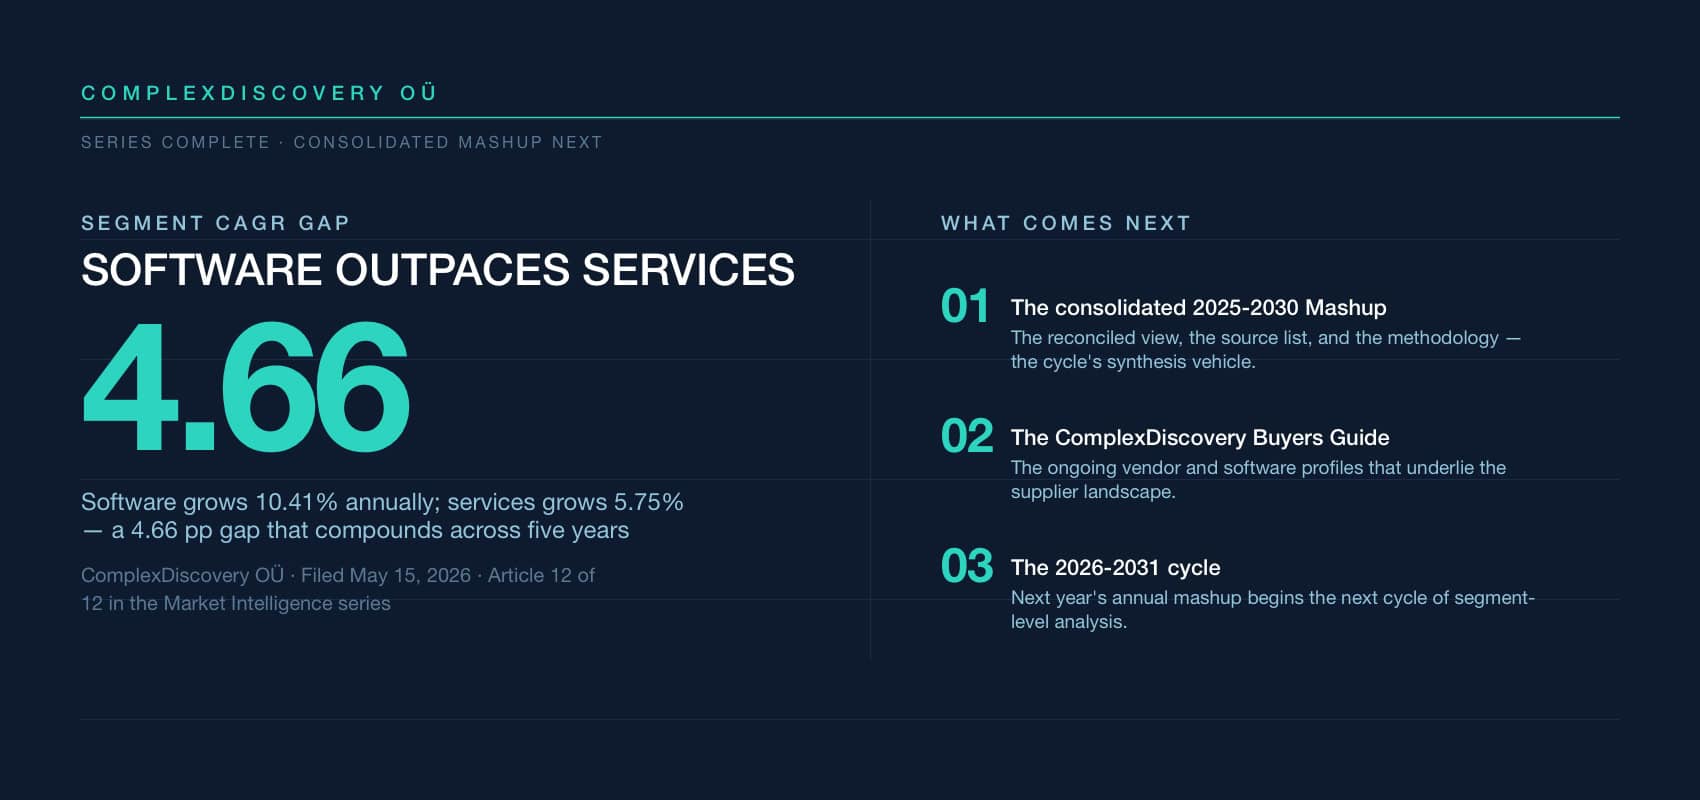
The arithmetic underneath the composition shift is straightforward. Software grows at a reconciled 10.41 percent compound annual rate from 2025 to 2030 – faster than the aggregate market by 2.97 percentage points and faster than services by 4.66 percentage points. Services grow at a reconciled 5.75 percent compound annual rate – slower than the aggregate by 1.69 percentage points. The 4.66-percentage-point segment CAGR gap is the structural force that produces the 5-percentage-point composition shift across five years, and it is the segment-level expression of the AI-driven channel reallocation that has been visible in vendor revenue patterns for several reporting cycles. The same review workflow that once generated services revenue at a per-document or per-hour rate now increasingly generates software revenue at a SaaS subscription or AI-inference rate – the work has not disappeared and in many cases has expanded as data volumes grow, but the channel through which the work gets billed has steadily shifted from services to software.
AI as the channel-reallocation mechanism
The mechanism behind the 4.66-percentage-point CAGR gap is, in large measure, an AI story. Predictive coding was the prior decade’s productivity bridge, embedded in software platforms and absorbing first-pass review labor at scale. Generative-AI-assisted review is the current decade’s bridge, compressing review labor further while expanding into pre-review analytics, issue coding, privilege screening, and production quality checks. Emerging agentic workflow features represent the next compression wave, automating sequences of decisions rather than individual decisions and increasingly billed through software channels as platform capabilities rather than through services channels as consulting engagements. Each generation of AI capability has reset the per-document review economics on the software side and the per-engagement managed-review economics on the services side. The reallocation does not eliminate services work – advisory, forensic, specialized response, and AI risk advisory continue to grow at premium rates that resist commoditization – but it does steadily shift the channel mix toward software.
How the 3.13x productivity mandate splits across the two segments
Article 11 in this Market Intelligence series documented the demand-side throughline: global data volume rises from 181 zettabytes in 2025 to 812 zettabytes in 2030, approximately 35 percent compounded annually, against an eDiscovery market growing at 7.44 percent compounded annually. The 27.6-percentage-point per-year gap compounds across five years into a 3.13-times productivity-per-dollar mandate – the same dollar must cover roughly 3.13 times more data in 2030 than in 2025 just to keep coverage flat. The software-versus-services synthesis here is, in large part, the segment-level resolution of that mandate. Software absorbs the productivity mandate primarily through capability compounding: AI-assisted review, AI-driven analytics, automated processing, and emerging agentic workflows that reset the per-unit economics each generation. Services absorb the productivity mandate primarily through mix shift: traditional managed-review revenue compresses while higher-value advisory and specialized-response work expands at premium rates. Both segments face the demand-side curve; both segments respond, but through different mechanisms. The 4.66-percentage-point CAGR gap is the financial signature of that asymmetric response.
What the consolidated 2025-2030 Mashup ties together
This installment is the twelfth and final article in the Market Intelligence series before the consolidated 2025-2030 eDiscovery Marketplace Mashup publishes as the synthesis vehicle. The Mashup brings together the aggregate market reconciliation, the segment-level views explored across the series – software, services, deployment, cloud composition, geography, demand sector, direct delivery, task share, and the demand-side data volume context – and the full source list, citation guidance, and methodology disclosure that the segment-level articles have referenced throughout the run. The Mashup is the citable resource for any quantitative claim drawn from this analysis; the segment articles are the editorial readings of what the reconciled numbers mean. For practitioners reading the series-end synthesis here for the first time, the next step is the consolidated Mashup itself – where the reconciled figures, the underlying source aggregation, and the methodology that produces a defensible mid-range view are all documented together.
The figures presented here are reconciled estimates aligned to a common scope (worldwide eDiscovery, software and services), a common geography, and a common timeframe (calendar years 2025 through 2030). They draw on publicly available third-party research, vendor disclosures, and analyst evaluation aggregated within the underlying market model. Forward estimates from past and present industry data sources are included in the model and presented as the current reconciled view. The 2025-2030 eDiscovery Marketplace Mashup is complete in its underlying analysis and will publish in its consolidated form as the culmination of the Market Intelligence series, with the full source list, citation guidance, and methodology disclosure included at that time.
If software’s CAGR continues to exceed services’ CAGR by roughly 4.66 percentage points a year, the segment crossover point – where software becomes the larger segment by absolute spend – falls outside the 2025-2030 window but inside the next decade. For practitioners reading the segment finale before the consolidated Mashup, the question is whether AI’s reallocation of work from services to software channels is now structural enough that the historical services-larger pattern will not return – or whether the next cycle of eDiscovery innovation will once again produce a category of work whose growth depends on human expertise that software cannot yet absorb at scale.
About the eDiscovery Market Size Mashup from ComplexDiscovery OÜ
The eDiscovery Market Size Mashup from ComplexDiscovery OÜ is an annual analytical report that provides a comprehensive overview of eDiscovery market trends, task-based expenditures, and technological advancements. Drawing on data from historical studies, market modeling, and future forecasting, the Mashup offers actionable insights for legal, business, and technology professionals. By examining key factors such as data growth, task allocation, and the impact of emerging technologies like generative AI, the Mashup serves as a citable resource for understanding the evolving dynamics of eDiscovery.
News sources
The following list is a directional resource set rather than an exact bibliography. It identifies representative inputs that shape this analysis; the core source listing, which provides a general understanding of data point sources over the lifecycle of the model, will publish with the consolidated 2025-2030 eDiscovery Market Size Mashup at the culmination of the Market Intelligence series.
- ComplexDiscovery OÜ. (2026). 2025-2030 eDiscovery market size mashup: Reconciled market size and task allocation trends (Unpublished working paper). ComplexDiscovery OÜ.
- The workstream of eDiscovery: Considering processes and tasks (ComplexDiscovery)
- Complete Look: ComplexDiscovery’s 2024-2029 eDiscovery Market Size Mashup (ComplexDiscovery)
- Where the money goes: Understanding litigant expenditures for producing electronic discovery (RAND Institute for Civil Justice)
- Market Intelligence: eDiscovery market growth from 2012 to 2030
- Market Intelligence: The eDiscovery task composition shift from 2025 to 2030
- Market Intelligence: The eDiscovery software market from 2025 to 2030
- Market Intelligence: The eDiscovery services market from 2025 to 2030
- Market Intelligence: eDiscovery software deployment, on-premise versus off-premise, 2025 to 2030
- Market Intelligence: eDiscovery cloud software – SaaS, PaaS, and IaaS, 2025 to 2030
- Market Intelligence: still American, but a little less so – eDiscovery geography through 2030
- Market Intelligence: non-government demand pulls ahead – the eDiscovery sector split through 2030
- Market Intelligence: where eDiscovery work gets bought – the delivery approach view, 2025 to 2030
- Market Intelligence: review’s quiet retreat, collection’s quiet surge – the eDiscovery task arc, 2012 to 2030
- Market Intelligence: the 3.13x productivity mandate underneath eDiscovery’s 2025 to 2030 arc

Assisted by GAI and LLM Technologies
Additional reading
- Andrew Haslam’s eDisclosure Systems Buyers Guide at 14: What the 1H 2026 update reveals
- A Complete Analysis of the Winter 2026 eDiscovery Pricing Survey
- The M&A Risk of Confusing Market Velocity with Marketing Capability
- Confidence Meets Complexity: Full Results from the 2H 2025 eDiscovery Business Confidence Survey
- Making the Subjective Objective: A Scoring Framework for Evaluating eDiscovery Vendor Viability in 2026
- eDiscovery Vendor Viability Scoring Tool: Making the Subjective Objective
- Beyond Public Cloud: The Enduring Case for Deployment Flexibility in eDiscovery
Source: ComplexDiscovery OÜ
ComplexDiscovery’s mission is to enable clarity for complex decisions by providing independent, data‑driven reporting, research, and commentary that make digital risk, legal technology, and regulatory change more legible for practitioners, policymakers, and business leaders.