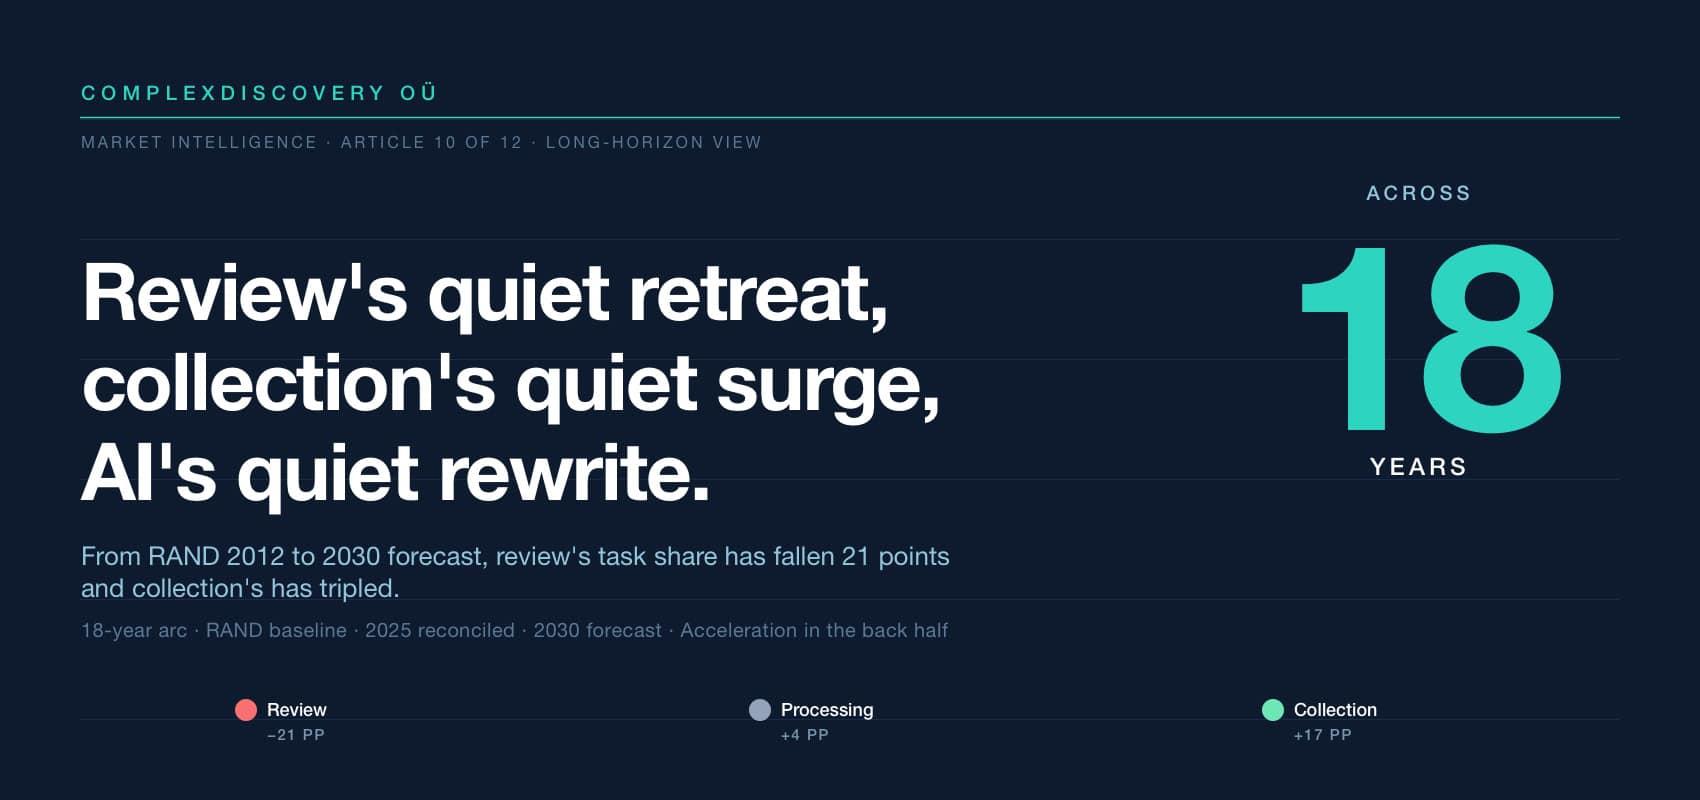
Editor’s Note: Across 18 years, the composition of where eDiscovery dollars get spent across the three core tasks has fundamentally rebalanced. The RAND Corporation’s foundational 2012 study, Where the Money Goes, placed review at 73 percent of total task spend, processing at 19 percent, and collection at 8 percent. By 2025, the reconciled view places review at 62 percent, processing at 21 percent, and collection at 17 percent. By 2030, the forecast places review at 52 percent, processing at 23 percent, and collection at 25 percent. Review has lost 21 percentage points of share across the long horizon; collection has expanded its share over threefold.
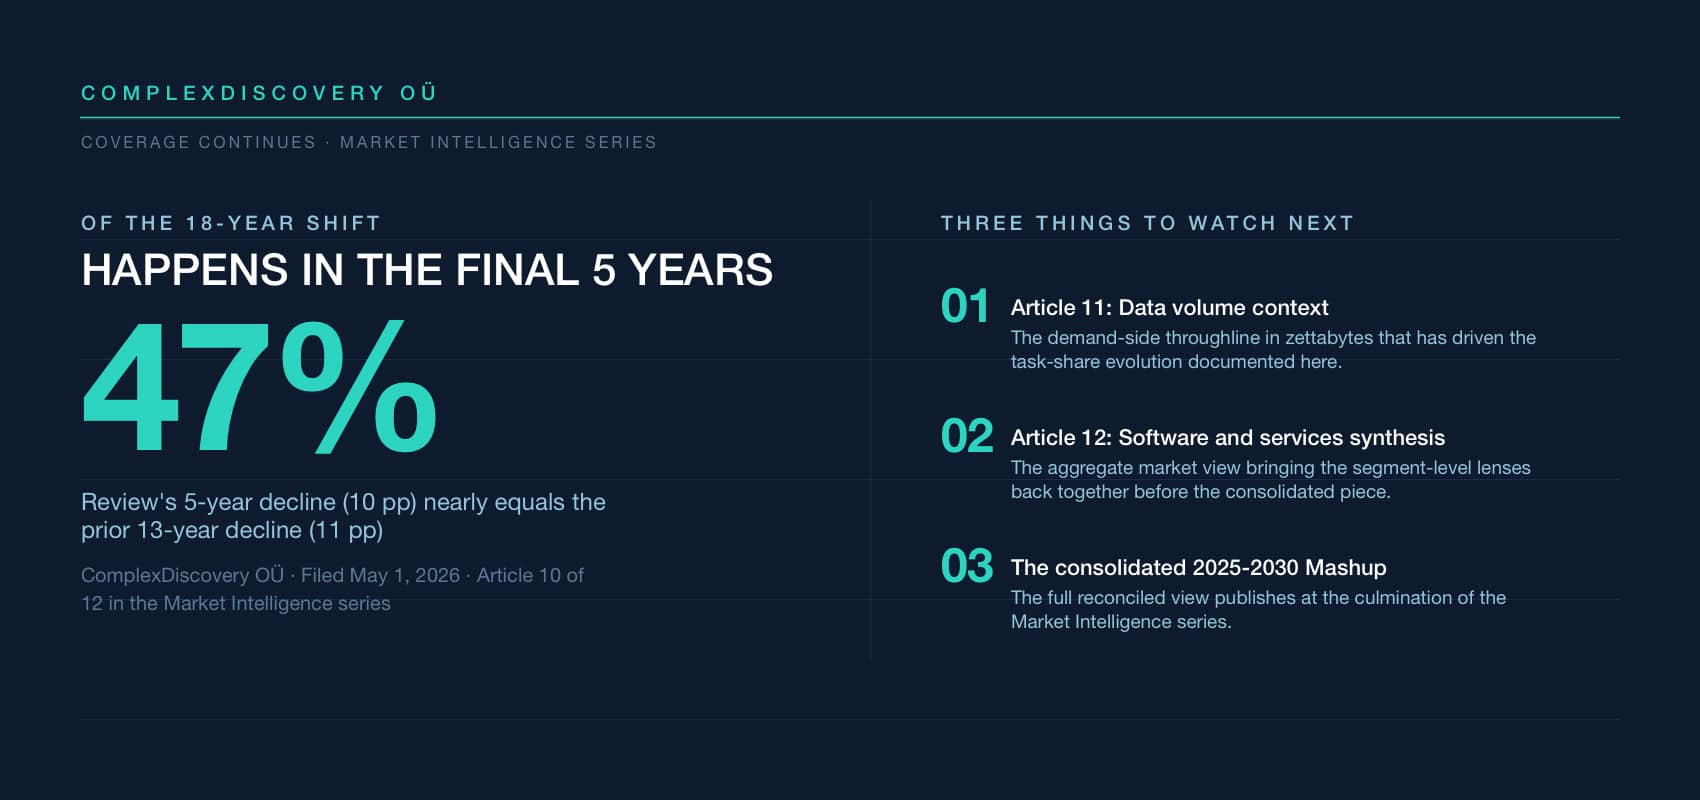
The pace of that rebalance is accelerating. The five-year share movement from 2025 to 2030 is nearly as large as the 13-year movement from 2012 to 2025. Two structural forces sustain the acceleration. AI-assisted review continues to compress per-document review labor faster than data growth can offset on the spend side – predictive coding now joined by generative-AI-assisted review and emerging agentic workflow features. Data-source proliferation continues to expand the collection scope – cloud collaboration platforms, mobile and ephemeral messaging, IoT, structured operational systems, and now generative AI prompt logs and model outputs each adding to the discoverable universe.
For cybersecurity, data privacy, regulatory compliance, and eDiscovery professionals, three observations follow. First, the task-share rebalance is structural rather than cyclical – the pattern has been visible since 2012 and has not reversed. Second, capital allocation and capability planning should anticipate the continued drift toward collection-heavy and processing-heavy task profiles. Third, the long-horizon view contextualizes near-term decisions: vendors and providers anchored primarily to review revenue should plan for continued share compression, while those with strong forensic and modern-collection capabilities are positioned for the fastest-growing absolute spend. The data volume context that follows this article will frame the demand-side trajectory in zettabytes that has driven this evolution, culminating in the consolidated 2025–2030 eDiscovery Marketplace Mashup.
Content Assessment: Market Intelligence: review's quiet retreat, collection's quiet surge - the eDiscovery task arc, 2012 to 2030
Information - 93%
Insight - 92%
Relevance - 93%
Objectivity - 94%
Authority - 95%
93%
Excellent
A short percentage-based assessment of the qualitative benefit expressed as a percentage of positive reception of the recent article from ComplexDiscovery OÜ titled, "Market Intelligence: review's quiet retreat, collection's quiet surge - the eDiscovery task arc, 2012 to 2030."
Industry Research – eDiscovery Market Sizing Beat
Market Intelligence: review’s quiet retreat, collection’s quiet surge – the eDiscovery task arc, 2012 to 2030
Across 18 years, review’s share of total task spend falls from 73 percent (RAND 2012) to a reconciled 62 percent (2025) to a projected 52 percent (2030); collection’s share expands over threefold from 8 percent to 25 percent – and the pace is accelerating
ComplexDiscovery Staff
Eighteen years ago, the RAND Corporation published Where the Money Goes – the first rigorous public study of how litigant dollars get split across the three core eDiscovery tasks. In that 2012 baseline, review consumed 73 percent of task spend, processing 19 percent, and collection 8 percent. By 2030, the reconciled forecast places review at 52 percent, processing at 23 percent, and collection at 25 percent. The 21-percentage-point decline in review’s share and the 17-percentage-point rise in collection’s share across 18 years reflect a structural rewrite of where eDiscovery work concentrates – one driven by AI-assisted review on the review side and by data-source proliferation on the collection side. And the pace of that rewrite is accelerating: roughly half of the 18-year share movement occurs in the five years from 2025 to 2030.
The RAND 2012 baseline
RAND’s 2012 study, authored by Nicholas Pace and Laura Zakaras for the RAND Institute for Civil Justice, remains the foundational public benchmark for eDiscovery task expenditure. Its central finding – that review consumed 73 percent of total task spend, against 19 percent for processing and 8 percent for collection – established the working assumption that document review was where eDiscovery dollars overwhelmingly concentrated. That ratio held in part because predictive coding adoption was nascent in 2012, generative AI was a decade from emerging, and the dominant model for handling large document populations was still human-driven first-pass review augmented by basic analytics. The 2012 baseline reflects a different eDiscovery industry than the one that exists today, and the gap between then and now is the central subject of this long-horizon view.
Chart: Relative Task Expenditures for Core eDiscovery Tasks (2012, 2025, 2030)
Relative Task Expenditures for Core eDiscovery Tasks
The 2025 midpoint: 11 percentage points of share has already moved
By 2025, the reconciled view places review at 62 percent of task spend, processing at 21 percent, and collection at 17 percent. Compared to the RAND 2012 baseline, review has lost 11 percentage points of share across 13 years; processing has gained 2 percentage points; collection has gained 9 percentage points. The 2025 midpoint reflects the cumulative effect of two structural forces operating across the prior decade: predictive coding adoption compressed per-document review labor at scale, and data-source proliferation (cloud collaboration platforms, mobile and ephemeral messaging, IoT, and structured operational systems) expanded the collection scope faster than collection automation could absorb. By 2025, review still held the majority share, but the long-running rebalance was clearly visible in the reconciled numbers.
The 2030 forecast: another 10 percentage points moves in five years
The 2030 forecast places review at 52 percent of task spend, processing at 23 percent, and collection at 25 percent. From the 2025 midpoint, review loses another 10 percentage points across five years; processing gains 2; collection gains 8. Across the five years from 2025 to 2030, the share movement is nearly as large as the 13-year movement from 2012 to 2025. The acceleration is the most consequential observation in this view. Three structural forces sustain it: AI-assisted review continues to absorb review labor at scale (predictive coding now joined by generative-AI-assisted review and emerging agentic workflow features); the data sources subject to collection continue to proliferate (with generative AI prompt logs, model outputs, and AI-generated artifacts emerging as discoverable categories that did not exist five years ago); and the long-running trend of services-to-software channel reallocation, documented earlier in this series, intersects directly with the task-share arc by compressing review labor in particular.
Why review’s share keeps declining
Review’s 21-percentage-point share decline across 18 years is, in large measure, an AI story. Each generation of AI-assisted review capability has reduced the human-attention input per document. Predictive coding was the prior decade’s automation default. Generative-AI-assisted review is the current decade’s emerging default. Early agentic workflow features – which automate sequences of review and processing tasks rather than individual decisions – represent the next compression wave. The total review-eligible data population has grown across the same 18 years, and absolute review spending continues to rise, but the per-document review cost compression has outpaced data growth on the spend side. Review remains the largest single task category by absolute spend through 2030, but its share trajectory continues to decline modestly each year. The structural pattern has been visible since 2012; it has not reversed.
Why collection’s share keeps climbing
Collection’s 17-percentage-point share gain across 18 years – tripling from 8 percent to a projected 25 percent – reflects the opposite structural force: data-source proliferation has continued to outpace collection automation. The data sources subject to potential collection have expanded across the past decade and continue to expand in the back half of the 2020s. Cloud collaboration platforms (Slack, Microsoft Teams, Google Workspace), mobile and ephemeral messaging, IoT and connected devices, structured operational systems, and now generative AI prompt logs and model outputs each add to the collection scope. Each new data source presents specialized forensic, technical, and legal challenges that resist commoditization. Specialized expertise around forensic collection, modern data sources, cross-border data transfer, and AI-related artifact preservation continues to command premium rates that the underlying data-volume surge has so far protected from compression. The same AI capability that compresses review labor has not yet meaningfully reduced the human and technical effort required to identify, preserve, and collect from new data sources.
What comes next in the Market Intelligence series
The data volume context that underlies every segment in this series will follow this article, framing the demand-side trajectory in zettabytes that has driven the task-share evolution documented here. The series will close with the consolidated 2025-2030 eDiscovery Marketplace Mashup as the synthesis point, bringing together every segmentation lens explored across the run.
The figures presented here are share percentages aligned to a common task taxonomy (collection, processing, and review as the three core eDiscovery tasks defined by the Electronic Discovery Reference Model and the foundational RAND 2012 study). The 2012 baseline figures derive directly from the RAND Corporation’s Where the Money Goes study by Nicholas Pace and Laura Zakaras. The 2025 figures and the 2030 forecast figures are reconciled estimates from the underlying market model. Forward estimates from past and present industry data sources are included in the model and presented as the current reconciled view. The 2025-2030 eDiscovery Marketplace Mashup is complete in its underlying analysis but remains unpublished in its consolidated form at this time. It will be published as the culmination of the Market Intelligence series, with the full source list, citation guidance, and methodology disclosure included at that time.
If review’s share has lost roughly 21 percentage points across 18 years and collection’s share has expanded over threefold across the same span, will the next 18 years see the same magnitude of rebalance – perhaps with processing eventually compressing under the same AI forces that have absorbed review – or has the eDiscovery task structure approached a stable equilibrium that the back half of the 2020s is finishing rather than starting?
About the eDiscovery Market Size Mashup from ComplexDiscovery OÜ
The eDiscovery Market Size Mashup from ComplexDiscovery OÜ is an annual analytical report that provides a comprehensive overview of eDiscovery market trends, task-based expenditures, and technological advancements. Drawing on data from historical studies, market modeling, and future forecasting, the Mashup offers actionable insights for legal, business, and technology professionals. By examining key factors such as data growth, task allocation, and the impact of emerging technologies like generative AI, the Mashup serves as a citable resource for understanding the evolving dynamics of eDiscovery.
News sources
The following list is a directional resource set rather than an exact bibliography. It identifies representative inputs that shape this analysis; the core source listing, which provides a general understanding of data point sources over the lifecycle of the model, will publish with the consolidated 2025-2030 eDiscovery Market Size Mashup at the culmination of the Market Intelligence series.
- ComplexDiscovery OÜ. (2026). 2025-2030 eDiscovery market size mashup: Reconciled market size and task allocation trends (Unpublished working paper). ComplexDiscovery OÜ.
- The workstream of eDiscovery: Considering processes and tasks (ComplexDiscovery)
- Complete Look: ComplexDiscovery’s 2024-2029 eDiscovery Market Size Mashup (ComplexDiscovery)
- Where the money goes: Understanding litigant expenditures for producing electronic discovery (RAND Institute for Civil Justice)
- Market Intelligence: eDiscovery market growth from 2012 to 2030
- Market Intelligence: The eDiscovery task composition shift from 2025 to 2030
- Market Intelligence: The eDiscovery software market from 2025 to 2030
- Market Intelligence: The eDiscovery services market from 2025 to 2030
- Market Intelligence: eDiscovery software deployment, on-premise versus off-premise, 2025 to 2030
- Market Intelligence: eDiscovery cloud software – SaaS, PaaS, and IaaS, 2025 to 2030
- Market Intelligence: still American, but a little less so – eDiscovery geography through 2030
- Market Intelligence: non-government demand pulls ahead – the eDiscovery sector split through 2030
- Market Intelligence: where eDiscovery work gets bought – the delivery approach view, 2025 to 2030

Assisted by GAI and LLM Technologies
Additional reading
- Andrew Haslam’s eDisclosure Systems Buyers Guide at 14: What the 1H 2026 update reveals
- A Complete Analysis of the Winter 2026 eDiscovery Pricing Survey
- The M&A Risk of Confusing Market Velocity with Marketing Capability
- Confidence Meets Complexity: Full Results from the 2H 2025 eDiscovery Business Confidence Survey
- Making the Subjective Objective: A Scoring Framework for Evaluating eDiscovery Vendor Viability in 2026
- eDiscovery Vendor Viability Scoring Tool: Making the Subjective Objective
- Beyond Public Cloud: The Enduring Case for Deployment Flexibility in eDiscovery
Source: ComplexDiscovery OÜ
ComplexDiscovery’s mission is to enable clarity for complex decisions by providing independent, data‑driven reporting, research, and commentary that make digital risk, legal technology, and regulatory change more legible for practitioners, policymakers, and business leaders.