Editor’s Note: The eDiscovery Market Size Mashup is a research tool now in its fourteenth annual cycle. Since 2012, it has tracked the worldwide eDiscovery market through three structural eras: the early-cloud era, when subscription consumption began to displace perpetual licensing; the AI-assisted-review era, when predictive coding reset per-document review economics; and the demand-and-response era that defines 2025 through 2030, when generative-AI-assisted review and emerging agentic workflow features compress per-document cost against a data curve growing roughly five times faster than the dollars available to discover it.
The purpose has remained consistent across the cycles: to give legal technology executives, consultants, analysts, service providers, investors, and corporate legal teams a reconciled mid-range view of the market that is internally consistent, methodologically disclosed, and updated each year against the latest available data.
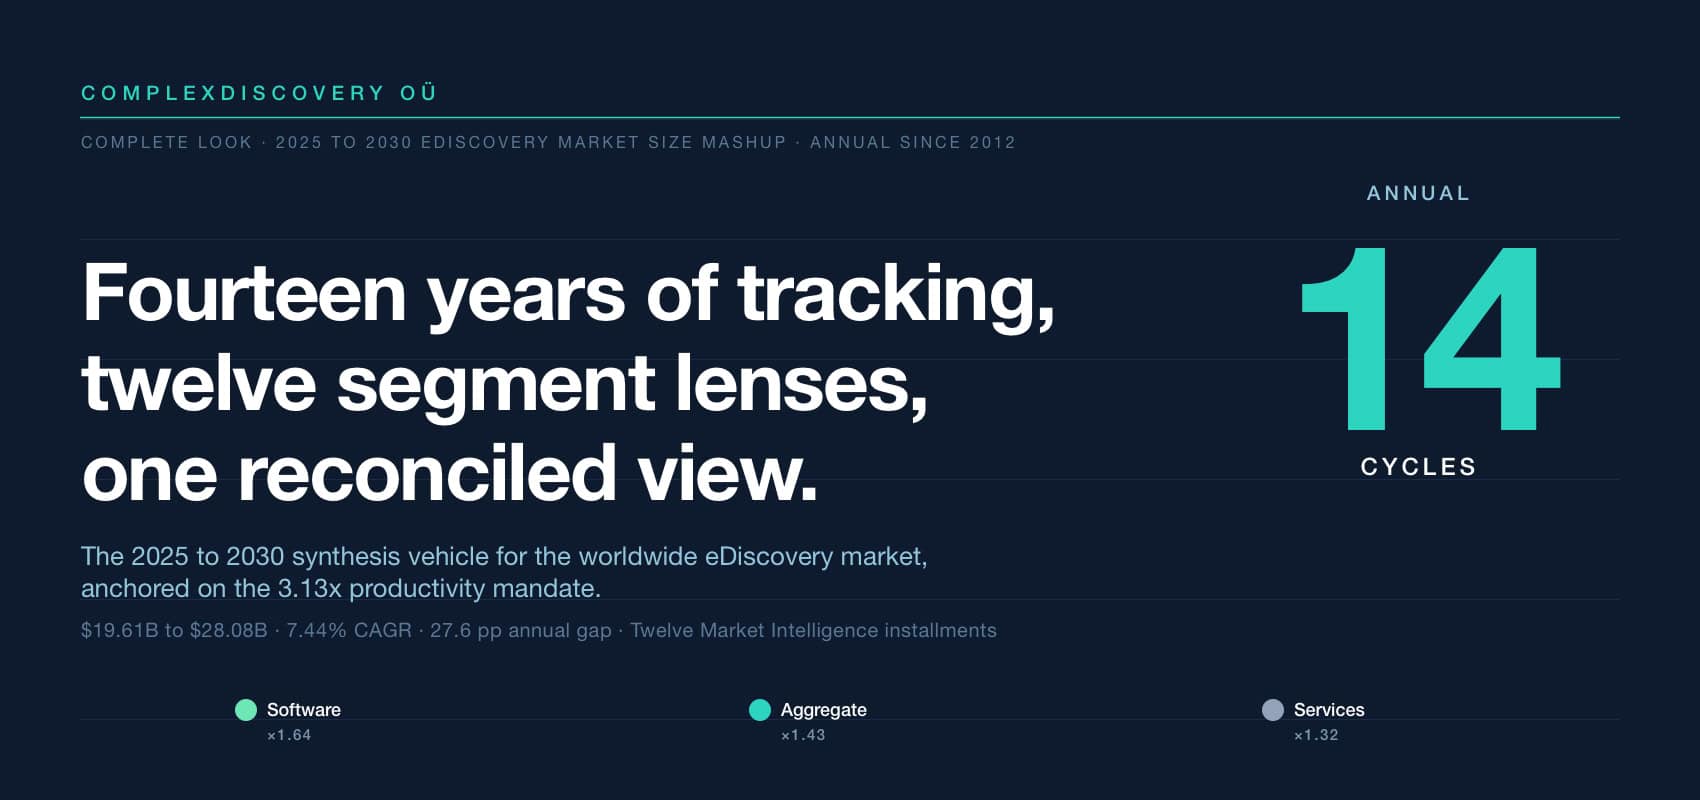
The 2025 to 2030 cycle places the worldwide eDiscovery market at an estimated $19.61 billion in 2025 and a projected $28.08 billion by 2030, a reconciled 7.44 percent compound annual growth rate. Underneath the aggregate trajectory sits the central arithmetic of the cycle: a 27.6-percentage-point annual gap between data growth and market growth that compounds across five years into a 3.13-times productivity-per-dollar mandate by 2030. Each of the twelve Market Intelligence installments published across this cycle examined a single segmentation lens. The consolidated synthesis that follows brings those lenses together as one citable reference for procurement, capability planning, market analysis, and vendor-selection decisions through the back half of the decade.
Content Assessment: Complete look: ComplexDiscovery OÜ's 2025 to 2030 eDiscovery market size mashup
Information - 94%
Insight - 95%
Relevance - 94%
Objectivity - 94%
Authority - 95%
94%
Excellent
A short percentage-based assessment of the qualitative benefit expressed as a percentage of positive reception of the recent article from ComplexDiscovery OÜ titled, "Complete look: ComplexDiscovery OÜ's 2025 to 2030 eDiscovery market size mashup."
Industry Research – eDiscovery Market Sizing Beat
Complete look: ComplexDiscovery OÜ’s 2025 to 2030 eDiscovery market size mashup
A synthesis of the worldwide eDiscovery market across software, services, deployment, geography, sector, delivery, task share, and the demand-side data growth curve, reconciled within the ComplexDiscovery OÜ eDiscovery Marketplace Mashup Model
ComplexDiscovery OÜ Staff
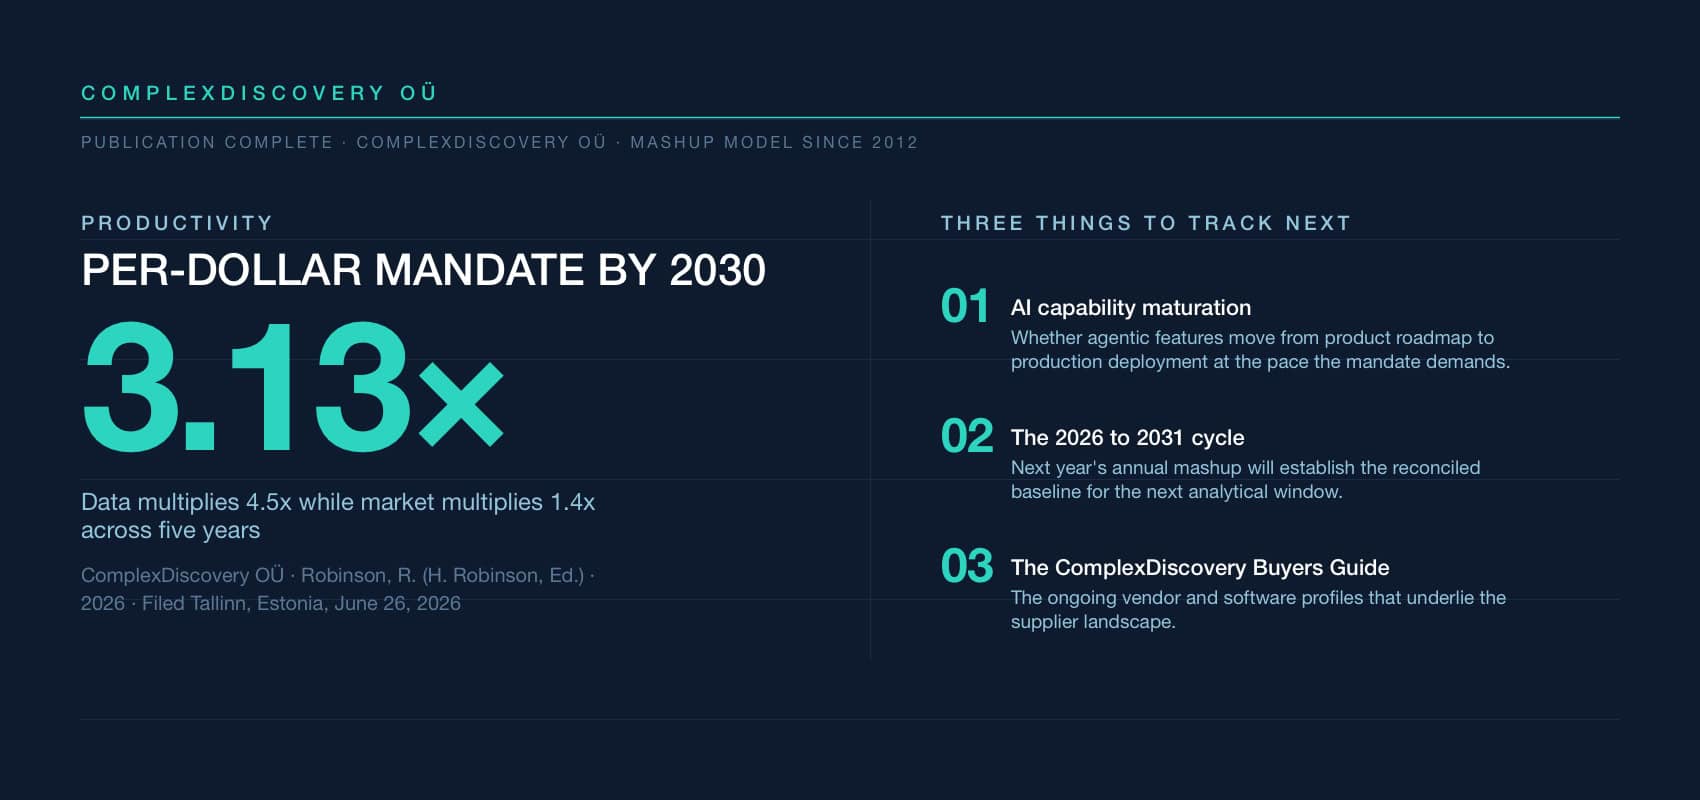
Two numbers shape worldwide eDiscovery through 2030, and they do not move at the same pace. The dollars to discover potentially relevant information rise from approximately 19.61 billion in 2025 to approximately 28.08 billion by 2030, a multiplier of 1.4 times. The data those dollars must reach rises from approximately 181 zettabytes in 2025 to approximately 812 zettabytes in 2030, a multiplier of 4.5 times. By the end of the decade, the same dollar must cover roughly 3.13 times more data than it does at the start. That arithmetic, larger than any single segment shift or composition change, is the structural force underneath this cycle of the mashup.
The 3.13-times productivity-per-dollar mandate that compounds out of the gap is a primary force underneath much of what follows. It pressures software to take share from services as channel billing shifts toward AI-driven workflows. It pressures review’s relative share of task spend to decline even as review dollars rise. It pressures cloud-first procurement to become the operational default. And it sits alongside other structural dynamics including subscription consumption migration, direct-buyer maturation, and supplier consolidation. None of those other dynamics is reducible to the productivity mandate alone, but each operates in a market where the mandate sets the demand-side ceiling. What follows is a tour of how the mandate lands across each segmentation lens explored in this cycle of the Market Intelligence series, from the aggregate market line down through software, services, deployment, cloud composition, geography, sector, delivery approach, task share, and the demand-side data growth curve underneath all of it.
The shape of the worldwide market
The reconciled view places the worldwide eDiscovery market at approximately 19.61 billion dollars in 2025, rising to approximately 28.08 billion dollars by 2030, a compound annual growth rate of approximately 7.44 percent. Software, the smaller of the two segments in absolute terms, grows at roughly 10.41 percent. Services, the larger segment, grows at roughly 5.75 percent. The 4.66-percentage-point segment CAGR gap translates into a 5-percentage-point composition shift across the five-year horizon. Software’s share of total worldwide eDiscovery spend rises from 34 percent in 2025 to 39 percent in 2030; services’ share falls correspondingly from 66 percent to 61 percent. Services remains the larger segment by absolute spend through 2030; the segment crossover point falls outside the 2025 to 2030 window.
eDiscovery Market Sizing - Past and Projected - 2026
Chart: eDiscovery Market Sizing, Past and Projected (2012 to 2030)
eDiscovery Software and Services Market (2025-2030)
Chart: eDiscovery Software and Services Market (2025 to 2030)
Software’s outperformance is not a fluke of the moment. The 4.66-percentage-point CAGR gap is, in large measure, the segment-level expression of an AI-driven channel reallocation: the same review workflow that once generated services revenue at a per-document or per-hour rate increasingly generates software revenue at a SaaS subscription or AI-inference rate. The work has not disappeared, and in many cases has expanded as data volumes grow, but the channel through which the work gets billed has steadily shifted from services to software. Services growth is slower but structurally durable; cross-border data, regulatory exposure, advisory work, and specialized response work sustain the services line even as software automates discrete tasks. The services segment in 2030 will not be a slower-growing version of the services segment of 2025; it will be a different mix.
How the composition is changing
Within the software segment, the cloud-first transition that has been underway for the better part of a decade is now functionally complete for new deployments. Off-premise software grows from approximately 5.29 billion dollars in 2025 to approximately 8.87 billion dollars in 2030, while on-premise software grows from 1.37 billion to 2.08 billion. On-premise solutions persist where security, sovereignty, or contractual constraints require them, but they are no longer the default for new procurement.
eDiscovery Software Market (2025-2030) - On + Off Premise
Chart: eDiscovery Software Market, On and Off Premise (2025 to 2030)
The more interesting subplot is inside the cloud category. SaaS holds roughly two-thirds of cloud spend in 2025 (approximately 67 percent) and drifts to approximately 63 percent by 2030 as PaaS and IaaS components compound at faster rates. PaaS rises from 15 percent of cloud spend to 17 percent; IaaS rises from 18 percent to 20 percent. The reason is simple: as advanced eDiscovery workloads incorporate large-scale processing, AI inference, vector search, and complex data engineering, customers and providers are increasingly integrating directly with platform and infrastructure services. Some of that integration appears in vendor SaaS revenue, and some appears as direct PaaS or IaaS spend.
eDiscovery Cloud Software Market (2025-2030)
Chart: eDiscovery Cloud Software Market (2025 to 2030)
Services growth lags software growth, but the headline number understates the qualitative shift inside services. Traditional managed-review revenue faces continued pricing compression as AI-assisted review compresses billable hours. Advisory services (litigation readiness, information governance, AI risk advisory) grow on the back of regulatory complexity. Specialized response work (forensic collection, second-request response, cross-border data transfer, regulatory inquiry support) grows at premium rates. The services segment in 2030 will not be a slower-growing version of the services segment of 2025; it will be a different mix.
eDiscovery Services Market (2025-2030)
Chart: eDiscovery Services Market (2025 to 2030)
Where the money is going
The United States continues to anchor the worldwide market, accounting for roughly 66 percent of global spend in 2025 and easing to roughly 64 percent in 2030. The shift toward rest-of-world is gradual but real, driven by the maturation of data protection regimes outside the United States, the internationalization of regulatory inquiries, and the gradual buildout of regional capacity. Within rest-of-world, the United Kingdom, Canada, Germany, Australia, and Japan continue to claim the largest sub-shares, with rising activity in Singapore, India, and parts of the Middle East.
eDiscovery Market Geographical Overview (2025-2030)
Chart: eDiscovery Market Geographical Overview (2025 to 2030)
The reconciliation distinguishes between government and regulatory demand on one hand and non-government (private-sector) demand on the other. Both grow over the period; non-government grows faster in both percentage and absolute terms. Non-government growth reflects expansion in civil litigation, internal investigations, corporate compliance, and AI-related risk advisory work. Government and regulatory growth reflects persistent investigative activity, ongoing premerger notification work, parallel inquiries in the European Union and the United Kingdom, and continued cross-border regulatory coordination.
eDiscovery Government and Non-Government Market Overview (2025-2030)
Chart: eDiscovery Government and Non-Government Market Overview (2025 to 2030)
Segmenting worldwide spend by who captures the direct economic transaction (corporations and governments, law firms, or service providers) reveals a clear picture. The corporations-and-governments category remains the dominant channel throughout the period, reflecting continued in-house consumption supplemented by direct vendor procurement. Service providers grow faster than law firms over the forecast period. Law firms increasingly act as orchestrators rather than primary procurement channels, with the work and the dollars flowing around them.
eDiscovery Market By Direct Delivery Approach (2025-2030)
Chart: eDiscovery Market by Direct Delivery Approach (2025 to 2030)
The task shift, and why it matters
The most consequential structural shift in the industry is not visible in the aggregate market line. It is in the composition of where eDiscovery dollars get spent across the three core tasks of collection, processing, and review. Review remains the largest single task expenditure throughout the period, but collection and processing capture increasing absolute and relative shares. Across a longer horizon, from RAND Corporation’s 2012 baseline through ComplexDiscovery OÜ’s 2025 modeling and 2030 forecast, review’s share of total task spend has fallen from 73 percent to a reconciled 62 percent to a projected 52 percent: a 21-percentage-point decline across 18 years. Collection, over the same span, has expanded over threefold, from 8 percent to a projected 25 percent, a 17-percentage-point gain. Processing has been comparatively stable, rising from 19 percent to 23 percent.
eDiscovery Market By Task (2025-2030)
Chart: eDiscovery Market by Task (2025 to 2030)
Relative Task Expenditures for Core eDiscovery Tasks
Chart: Relative Task Expenditures for Core eDiscovery Tasks (2012, 2025, 2030)
The pace of the rebalance is accelerating. Roughly 47 percent of the 18-year share movement happens in the final five years from 2025 to 2030. Review’s 5-year decline of 10 percentage points nearly equals the prior 13-year decline of 11 percentage points. The trend is consistent with a demand-and-response dynamic rather than two independent forces operating in parallel. The demand side is the growth in data volume subject to potential collection. The supply-side response is AI-assisted review’s compression of per-document review costs, with predictive coding through the prior decade, generative-AI-assisted review through the current decade, and emerging agentic workflow features as the next compression wave. Data growth raises absolute review work to be done; AI compression compresses per-document review prices. Whether the resulting absolute review spend rises, falls, or stays flat depends on the relative pace of the two. In the reconciled view, review absolute spend continues to grow modestly, from approximately 12.16 billion dollars in 2025 to approximately 14.60 billion dollars in 2030, but materially slower than the aggregate market, which is why review’s share declines. For practitioners and providers, the practical consequence is that capacity decisions made today should anticipate the structural drift toward collection-heavy and processing-heavy task profiles.
The demand side, data growth as the underlying force
Worldwide data volumes are projected to grow from approximately 181 zettabytes in 2025 to approximately 812 zettabytes in 2030, a compound annual growth rate of approximately 35 percent. Enterprise-held data, the subset most relevant to discoverable information, expands from approximately 54 zettabytes to approximately 243 zettabytes over the same period at the same rate, holding steady at roughly 30 percent of the global total. The 181 zettabyte 2025 anchor is consistent with IDC’s Global DataSphere baseline. The 35 percent CAGR through 2030 reflects the Mashup Model’s reconciliation across data-universe forecasts and enterprise-specific projections, and sits on the upper end of published industry growth estimates. It is higher than IDC’s headline total-data forecast trajectory and lower than the most aggressive AI-content-driven projections.
Data Volume and Growth in Zettabytes (2025-2030)
Chart: Data Volume and Growth in Zettabytes (2025 to 2030)
The 35-percent data CAGR set against the 7.44-percent eDiscovery market CAGR is the central arithmetic of the cycle. Across the five-year horizon, global data multiplies roughly 4.5 times (4.484x, from 181 to 812 zettabytes); the worldwide eDiscovery market multiplies roughly 1.4 times (1.432x, from 19.6 to 28.1 billion dollars). Divide one by the other and the productivity-per-dollar requirement falls out: 4.484 ÷ 1.432 ≈ 3.13. By 2030, the same dollar must process, store, search, review, and produce against roughly 3.13 times more data than it did in 2025 just to maintain the same coverage ratio. That is not a marginal improvement. It is the productivity mandate that defines the decade for the industry. The mandate sits underneath several of the shifts documented above: the segment-level CAGR gap reflects the channel through which the productivity gain flows; the task-share rebalance reflects where the gain lands at the workflow level. AI capability compounding (predictive coding through the prior decade, generative-AI-assisted review through the current decade, emerging agentic workflow features as the next compression wave) is the bridge that must close the gap. Whether the bridge closes the gap fully, partially, or in stages depends on the pace at which the current generation of tooling matures, the pace at which agentic features move from product roadmap to production deployment, and whether the industry holds to full-coverage discovery as the standard or moves toward risk-tiered coverage that reserves the most intensive workflows for the documents that matter most. The mandate sets the ceiling; the answer to how the ceiling gets met is the open question of the decade.
What the reconciled view implies
The reconciled view supports a small set of interpretive points, none of them prescriptive, all of them grounded in the figures. For software vendors, the 10.41 percent reconciled software CAGR outpaces services by 4.66 percentage points a year, and the vendors positioned to capture a disproportionate share of incremental software dollars are those integrating AI-assisted review, modular SaaS delivery, and platform-aware processing into the same product surface. For service providers, slower nominal growth does not imply a less attractive market. It implies a different one. Providers that reposition around higher-value advisory and specialized regulatory response can outpace the segment headline. For law firms, the modest share of direct economic transactions captured by law firms suggests a continued shift toward orchestration and advisory positioning rather than primary procurement. For corporate and government legal teams, in-house consumption continues to dominate the direct delivery approach. Build-versus-buy on internal capabilities, governance over AI use in discovery, and readiness for second-request response remain the central program-level questions. For investors and analysts, the dynamics support a continued investment thesis around cloud-native, AI-enabled software platforms, with margin pressure on traditional services and continued consolidation at the supplier level.
Closing the loop
At the start of this analysis, the cycle was framed around two numbers that do not move at the same pace: 19.61 billion dollars rising to 28.08 billion against 181 zettabytes rising to 812 zettabytes. The productivity-per-dollar mandate that compounds out of that gap, 3.13 times by 2030, is not a forecast of efficiency. It is a measurement of pressure. The segment, task, and channel shifts documented above are the visible places where the pressure shows up. AI capability compounding is the bridge that must close the gap. Whether the industry meets that pressure through AI-assisted tooling alone, or moves toward a structural redefinition of what discovery coverage means in practice, from full coverage of every potentially relevant artifact to risk-tiered coverage that reserves the most intensive workflows for the documents that matter most, is the open question of the decade. The mashup measures the pressure. The industry answers it.
About the Model behind these figures
All quantitative figures in this analysis are drawn from the ComplexDiscovery OÜ eDiscovery Marketplace Mashup Model, a proprietary analyst-aggregation framework that reconciles publicly available third-party research, vendor disclosures, and industry reference work into a single defensible mid-range view of the worldwide eDiscovery market. The Model is a research aggregation tool maintained by ComplexDiscovery OÜ. It is not distributed publicly and does not constitute primary research; figures cited here represent reconciled estimates aligned to a common scope, geography, and timeframe.
This Mashup is the public synthesis vehicle for the Model’s 2025 to 2030 cycle. It provides the consolidated reconciliation across software, services, deployment, cloud composition, geography, sector, delivery approach, task composition, long-horizon task share, and data growth, along with a representative listing of the organizations and publications that inform the Model’s source aggregation.
Methodology
The scope of this synthesis is the worldwide eDiscovery market, encompassing software and services, expressed in U.S. dollars, across calendar years 2025 through 2030. Reconciliation of varying market definitions, geographic scopes, and source methodologies is presented as ranges with assumptions disclosed where precise alignment is not possible. The 2012 task baseline cited in the long-horizon task share section derives from the RAND Corporation 2012 study by Pace and Zakaras. Compound annual growth rates are derived using the standard formula ((End divided by Start) raised to the power of one over the number of years) minus 1, with five years as the denominator unless otherwise noted. The 3.13-times productivity mandate is a coverage-flat ratio (data multiplier divided by market multiplier), not a forecast of realized productivity gains.
Citing this analysis
The primary citable resource for the figures and analysis in this article is the ComplexDiscovery OÜ eDiscovery Marketplace Mashup Model. The Model is the aggregated research artifact maintained by ComplexDiscovery OÜ since 2012 and is the appropriate citation when referencing data points, projections, segmentation, or analyses derived from any ComplexDiscovery annual eDiscovery market size mashup.
Suggested citation: Robinson, R. (2026). 2025 to 2030 eDiscovery Market Size Mashup (H. Robinson, Ed.). ComplexDiscovery OÜ.
Sources informing the Model
The listing below provides an overview of the organizations and publications whose data points have informed the development of the Model over time. The Model itself aggregates publicly available content (including abstracts, excerpts, quotes, references, and data points) from these sources, with inputs collected since the inaugural ComplexDiscovery eDiscovery Market Size Mashup in 2012. Individual entries are presented for transparency about Model construction and are not the appropriate citation for figures appearing in this analysis; readers referencing figures should cite the Model. Market modeling rounding may result in slight differences in aggregate numbers.
- 360 Market Updates / 360iResearch
- Aberdeen
- ACG Partners
- Allied Market Research
- American Medical Association
- BMC
- Catalyst Investors
- ComplexDiscovery OÜ eDiscovery Marketplace Mashup Model (incorporating industry news, editorial analysis, eDiscovery Business Confidence Surveys, eDiscovery Pricing Surveys, and prior Annual eDiscovery Market Size Mashups since 2012)
- CS Disco
- Discovery & Legal Technology Association (DLTA)
- eDiscovery Journal
- EY
- Facts and Factors
- Forbes
- FRONTEO (UBIC)
- Future Market Insights
- Gartner
- Georgetown Law Center for the Study of the Legal Profession and Thomson Reuters Legal Executive Institute
- Global Industry Analysts
- Grand View Research
- Greentarget
- Harvard Business Review
- Houlihan Lokey
- i360
- IBIS World
- IDC
- Industry eDiscovery Provider, Analyst, and Investor Briefings and Discussions
- Industry Observer Estimations (Multiple Observers)
- Industry Research (Company)
- KLDiscovery
- Markets and Markets
- Mordor Intelligence
- Nasdaq
- Nuix
- P&S Market Research
- Prescient & Strategic Intelligence
- RAND Institute for Civil Justice
- Relativity Fest, Industry Panel Discussions
- Reports and Data
- Research and Markets
- Richmond Journal of Law and Technology
- Statista
- The Conference Board
- The Radicati Group
- Third-Party Market Studies (Independent Industry Briefings)
- Transparency Market Research
- U.S. Bureau of Economic Analysis
- U.S. Department of Commerce, International Trade Administration
- U.S. Securities and Exchange Commission (public company filings)
- Zion Market Research
Market Intelligence series reports (2025-30 eDiscovery market size mashup)
- Market Intelligence: eDiscovery market growth from 2012 to 2030
- Market Intelligence: The eDiscovery task composition shift from 2025 to 2030
- Market Intelligence: The eDiscovery software market from 2025 to 2030
- Market Intelligence: The eDiscovery services market from 2025 to 2030
- Market Intelligence: eDiscovery software deployment, on-premise versus off-premise, 2025 to 2030
- Market Intelligence: eDiscovery cloud software – SaaS, PaaS, and IaaS, 2025 to 2030
- Market Intelligence: still American, but a little less so – eDiscovery geography through 2030
- Market Intelligence: non-government demand pulls ahead – the eDiscovery sector split through 2030
- Market Intelligence: where eDiscovery work gets bought – the delivery approach view, 2025 to 2030
- Market Intelligence: review’s quiet retreat, collection’s quiet surge – the eDiscovery task arc, 2012 to 2030
- Market Intelligence: the 3.13x productivity mandate underneath eDiscovery’s 2025 to 2030 arc
- Market Intelligence: AI reallocates eDiscovery channels as software gains five share points through 2030

Assisted by GAI and LLM Technologies
Additional reading
- The workstream of eDiscovery: Considering processes and tasks (ComplexDiscovery)
- Complete Look: ComplexDiscovery’s 2024-2029 eDiscovery Market Size Mashup (ComplexDiscovery)
- Andrew Haslam’s eDisclosure Systems Buyers Guide at 14: What the 1H 2026 update reveals
- A Complete Analysis of the Winter 2026 eDiscovery Pricing Survey
- The M&A Risk of Confusing Market Velocity with Marketing Capability
- Confidence Meets Complexity: Full Results from the 2H 2025 eDiscovery Business Confidence Survey
- Making the Subjective Objective: A Scoring Framework for Evaluating eDiscovery Vendor Viability in 2026
- eDiscovery Vendor Viability Scoring Tool: Making the Subjective Objective
- Beyond Public Cloud: The Enduring Case for Deployment Flexibility in eDiscovery
Source: ComplexDiscovery OÜ

ComplexDiscovery’s mission is to enable clarity for complex decisions by providing independent, data‑driven reporting, research, and commentary that make digital risk, legal technology, and regulatory change more legible for practitioners, policymakers, and business leaders.