
Editor’s Note: The demand-side context underneath the eDiscovery market is, in the end, one number with one trajectory: global data volume rises from approximately 181 zettabytes in 2025 to approximately 812 zettabytes in 2030 – roughly 35 percent compounded annually. Enterprise data tracks that same trajectory, scaling from approximately 54 zettabytes to approximately 243 zettabytes while holding steady at roughly 30 percent of the global total. Across the same five-year window, the worldwide eDiscovery market grows from roughly 19.6 billion dollars to roughly 28.1 billion – approximately 7.44 percent compounded annually. The 27.6-percentage-point per-year gap between data growth and dollar growth is the structural force that explains every segmentation lens covered in the prior ten articles in this Market Intelligence series.
The arithmetic is unforgiving. By 2030, the same dollar must cover approximately 3.13 times more data than it did in 2025 just to maintain the same coverage ratio. That productivity-per-dollar mandate is the throughline behind software’s outpacing of services in growth, behind the cloud-first procurement default, behind review’s quiet share decline, behind collection’s surge as new data sources proliferate, and behind the consolidation pattern visible across the supplier landscape. Every segmentation choice the industry is making is, at some level, a response to the 35-to-7 gap.
For cybersecurity, data privacy, regulatory compliance, and eDiscovery professionals, three observations follow. First, the demand-side curve is structural rather than cyclical – the 35 percent data growth trajectory has been the consensus forecast across the prior decade and continues across the current forecast window. Second, the productivity-per-dollar requirement is large enough that it cannot be met through marginal efficiency gains; it requires sustained capability investment, primarily in AI-assisted tooling, and likely a structural rethinking of what discovery coverage means in practice. Third, the composition of the data underneath the headline volume is shifting – more conversational, more AI-generated, more streamed – and the capability investments that close the gap need to track the composition shift, not just the volume.
Content Assessment: Market Intelligence: the 35-to-7 gap – the demand-side throughline underneath eDiscovery’s 2025 to 2030 arc
Information - 93%
Insight - 94%
Relevance - 92%
Objectivity - 94%
Authority - 93%
93%
Excellent
A short percentage-based assessment of the qualitative benefit expressed as a percentage of positive reception of the recent article from ComplexDiscovery OÜ titled, "Market Intelligence: the 3.13x productivity mandate underneath eDiscovery's 2025 to 2030 arc."
Industry Research – eDiscovery Market Sizing Beat
Market Intelligence: the 3.13x productivity mandate underneath eDiscovery’s 2025 to 2030 arc
Global data volume rises from 181 zettabytes in 2025 to 812 zettabytes in 2030, approximately 35 percent compound annual growth; the worldwide eDiscovery market grows from 19.6 billion dollars to 28.1 billion dollars across the same period, approximately 7.4 percent compound annual growth – a 27.6-percentage-point structural gap that AI-driven productivity, not capacity, must close
ComplexDiscovery Staff
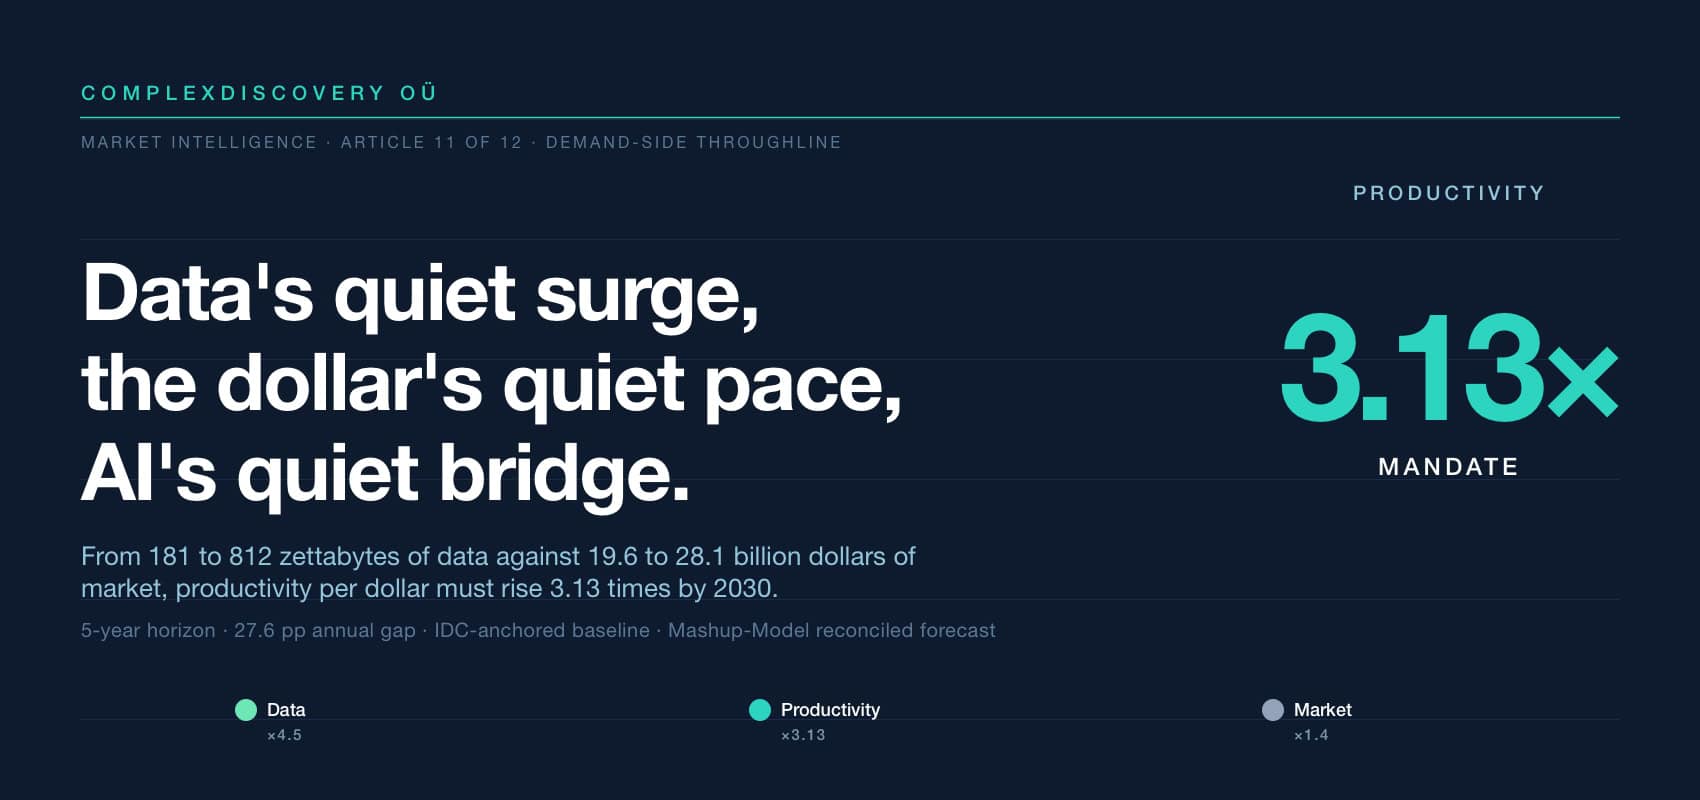
There is a single number underneath every other number in the Market Intelligence series, and it is not in dollars. It is in zettabytes. In 2025, the world created, captured, copied, and consumed roughly 181 zettabytes of data. In 2030, the projected total reaches roughly 812 zettabytes – a 4.5-times expansion across five years, or approximately 35 percent compounded annually. Across the same period, the worldwide eDiscovery market grows from roughly 19.6 billion dollars to roughly 28.1 billion – a 1.43-times expansion, or approximately 7.44 percent compounded annually. The gap between those two trajectories – some 27.6 percentage points per year of compounding difference – is the most consequential structural force in the eDiscovery industry, and it is the demand-side context underneath every segmentation lens explored across the prior ten articles in this series. The articles ahead describe how the gap gets closed. This article describes why the gap exists in the first place.
The 2025 baseline: 181 zettabytes globally, 54 zettabytes enterprise
In 2025, global data volume sat at approximately 181 zettabytes, of which approximately 54 zettabytes – 30.0 percent of the total – was enterprise data. The split between consumer and enterprise data has stayed remarkably stable across the past several years and is projected to hold at roughly the same 30 percent enterprise share across the entire 2025-2030 forecast window. The structural composition of global data has shifted – more is generated by machines than by humans, more is real-time than archival, more is unstructured than structured – but the enterprise wedge as a percentage of the whole has been a stable anchor for demand modeling. The 54 zettabytes of enterprise data in 2025 is the relevant denominator for eDiscovery: the larger the enterprise data surface area, the larger the potential discovery footprint.
Chart: Data Volume and Growth in Zettabytes (2025-2030)
Data Volume and Growth in Zettabytes (2025-2030)
The 2030 forecast: 812 zettabytes globally, 243 zettabytes enterprise
By 2030, the projected global total reaches approximately 812 zettabytes, with enterprise data at approximately 243 zettabytes – again 30.0 percent of the total. Across five years, global data multiplies roughly 4.5 times; enterprise data does the same. The 181 zettabyte 2025 anchor is consistent with IDC’s Global DataSphere baseline. The 35 percent compound annual growth rate through 2030 reflects the Mashup Model’s reconciliation across data-universe forecasts and enterprise-specific projections, and sits on the upper end of published industry growth estimates – higher than IDC’s headline total-data forecast trajectory, lower than the most aggressive AI-content-driven projections, and consistent with enterprise-segment-focused estimates that incorporate the surge in cloud workloads, video, sensor data, AI-generated artifacts, and retention friction at the disposition end. The 2030 figure is the relevant numerator for any discussion of eDiscovery capacity through the decade.
The 35-to-7 gap: what 27.6 percentage points of compounding difference means
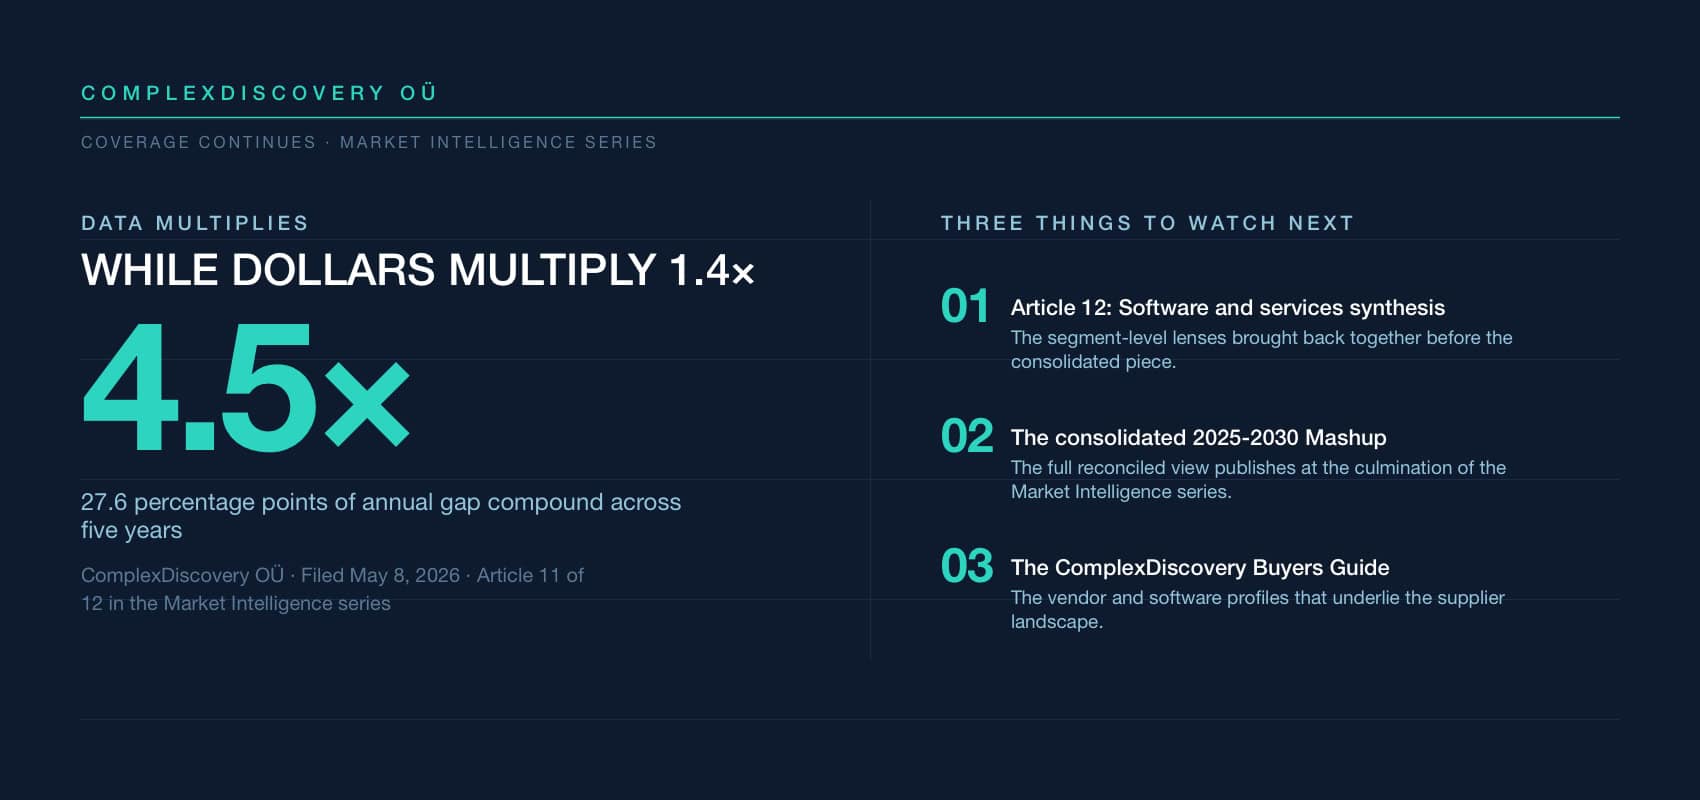
The arithmetic underneath the demand-side throughline is straightforward and unforgiving. Across the five years from 2025 to 2030, global data multiplies roughly 4.5 times (181 to 812 zettabytes, or 4.484x); the worldwide eDiscovery market multiplies roughly 1.4 times (19.6 to 28.1 billion dollars, or 1.432x). Divide one by the other and the productivity-per-dollar requirement falls out: 4.484 ÷ 1.432 ≈ 3.13. By 2030, the same dollar must process, store, search, review, and produce against roughly 3.13 times more data than it did in 2025 just to maintain the same coverage ratio. If full coverage is the standard – if every relevant document, message, prompt log, and artifact gets identified, preserved, collected, processed, reviewed, and produced – then productivity per dollar must rise roughly 3.13 times across five years. That is not a marginal improvement. That is the productivity mandate that defines the decade for the industry.
AI as the productivity bridge
The reason the 35-to-7 gap does not break the eDiscovery cost model is that AI capability has been compounding alongside it. Predictive coding was the prior decade’s productivity bridge, absorbing first-pass review labor at scale and resetting the per-document review economics. Generative-AI-assisted review is the current decade’s bridge, compressing review labor further while expanding into pre-review analytics, issue coding, privilege screening, and production quality checks. Emerging agentic workflow features – which automate sequences of review and processing decisions rather than individual decisions – represent the next compression wave. Each generation of AI capability has reset the productivity-per-dollar baseline; the long-horizon task arc documented in the prior article in this series traces that resetting directly. Whether the 3.13-times productivity-per-dollar requirement through 2030 is fully met or partially met will depend on the pace at which the current generation of AI-assisted tooling matures and the pace at which agentic features move from product roadmap to production deployment.
Where the discoverable data is coming from
The 4.5-times enterprise data expansion across 2025-2030 is not distributed evenly across data types or sources. Cloud collaboration platforms – Microsoft Teams, Slack, Google Workspace, and adjacent tooling – continue to be a leading driver, with message volumes growing faster than the underlying user counts because hybrid work has changed messaging frequency norms. Mobile and ephemeral messaging continues to expand as a discoverable category, with disappearing-message platforms presenting distinctive preservation challenges. Cloud-hosted file storage volumes scale with the broader migration of structured and unstructured enterprise content to platform services. Generative AI is now itself a meaningful data-source category: prompt logs, model outputs, retrieval-augmented-generation traces, agent activity records, and AI-generated artifacts each add to the discoverable surface and each present distinctive forensic and chain-of-custody questions. Internet-of-things and connected-device telemetry continues to grow as operational data increasingly intersects with regulatory inquiries and product-liability matters. The composition of the 812 zettabytes that the world will hold in 2030 will look different from the composition of the 181 zettabytes the world holds in 2025 – more AI-generated, more conversational, more streamed, more sensor-derived – and the eDiscovery industry’s capability investments need to track the composition shift, not just the headline volume.
What comes next in the Market Intelligence series
The next article in the Market Intelligence series synthesizes the software and services segment views developed across the run, bringing the segment-level lenses back together before the consolidated piece. The series closes with the consolidated 2025-2030 eDiscovery Marketplace Mashup as the full reconciled view, with the complete source list, citation guidance, and methodology disclosure included at that time.
The figures presented here are zettabyte totals reconciled within the underlying market model from publicly available global-data-universe research and industry forecasts. The 2025 baseline and 2030 forecast are presented as a defensible mid-range view rather than as a precise prediction. Forward estimates from past and present industry data sources are included in the model and presented as the current reconciled view. The 2025-2030 eDiscovery Marketplace Mashup is complete in its underlying analysis but remains unpublished in its consolidated form at this time. It will be published as the culmination of the Market Intelligence series, with the full source list, citation guidance, and methodology disclosure included at that time.
If the productivity-per-dollar requirement through 2030 is 3.13 times – simply to keep coverage flat against the data growth that the industry is already projecting – is that level of productivity gain achievable through the current generation of AI-assisted tooling alone, or does meeting the demand-side curve require a structural shift in what discovery coverage actually means: from full coverage of every potentially relevant artifact to risk-tiered coverage that reserves the most intensive workflows for the documents that matter most?
About the eDiscovery Market Size Mashup from ComplexDiscovery OÜ
The eDiscovery Market Size Mashup from ComplexDiscovery OÜ is an annual analytical report that provides a comprehensive overview of eDiscovery market trends, task-based expenditures, and technological advancements. Drawing on data from historical studies, market modeling, and future forecasting, the Mashup offers actionable insights for legal, business, and technology professionals. By examining key factors such as data growth, task allocation, and the impact of emerging technologies like generative AI, the Mashup serves as a citable resource for understanding the evolving dynamics of eDiscovery.
News sources
The following list is a directional resource set rather than an exact bibliography. It identifies representative inputs that shape this analysis; the core source listing, which provides a general understanding of data point sources over the lifecycle of the model, will publish with the consolidated 2025-2030 eDiscovery Market Size Mashup at the culmination of the Market Intelligence series.
- ComplexDiscovery OÜ. (2026). 2025-2030 eDiscovery market size mashup: Reconciled market size and task allocation trends (Unpublished working paper). ComplexDiscovery OÜ.
- The workstream of eDiscovery: Considering processes and tasks (ComplexDiscovery)
- Complete Look: ComplexDiscovery’s 2024-2029 eDiscovery Market Size Mashup (ComplexDiscovery)
- Where the money goes: Understanding litigant expenditures for producing electronic discovery (RAND Institute for Civil Justice)
- Market Intelligence: eDiscovery market growth from 2012 to 2030
- Market Intelligence: The eDiscovery task composition shift from 2025 to 2030
- Market Intelligence: The eDiscovery software market from 2025 to 2030
- Market Intelligence: The eDiscovery services market from 2025 to 2030
- Market Intelligence: eDiscovery software deployment, on-premise versus off-premise, 2025 to 2030
- Market Intelligence: eDiscovery cloud software – SaaS, PaaS, and IaaS, 2025 to 2030
- Market Intelligence: still American, but a little less so – eDiscovery geography through 2030
- Market Intelligence: non-government demand pulls ahead – the eDiscovery sector split through 2030
- Market Intelligence: where eDiscovery work gets bought – the delivery approach view, 2025 to 2030
- Market Intelligence: review’s quiet retreat, collection’s quiet surge – the eDiscovery task arc, 2012 to 2030

Assisted by GAI and LLM Technologies
Additional reading
- Andrew Haslam’s eDisclosure Systems Buyers Guide at 14: What the 1H 2026 update reveals
- A Complete Analysis of the Winter 2026 eDiscovery Pricing Survey
- The M&A Risk of Confusing Market Velocity with Marketing Capability
- Confidence Meets Complexity: Full Results from the 2H 2025 eDiscovery Business Confidence Survey
- Making the Subjective Objective: A Scoring Framework for Evaluating eDiscovery Vendor Viability in 2026
- eDiscovery Vendor Viability Scoring Tool: Making the Subjective Objective
- Beyond Public Cloud: The Enduring Case for Deployment Flexibility in eDiscovery
Source: ComplexDiscovery OÜ
ComplexDiscovery’s mission is to enable clarity for complex decisions by providing independent, data‑driven reporting, research, and commentary that make digital risk, legal technology, and regulatory change more legible for practitioners, policymakers, and business leaders.