

Editor’s Note: Payment cycles are stretching across eDiscovery, and fewer leaders than ever can see it happening. The closing installment of our 1H 2026 survey series finds 45.83 percent of respondents unable to describe their own DSO trajectory while slowing payments outnumber accelerating ones 14 to one, the most lopsided reading in the series’ recent history.
The findings reach every discipline this publication serves. For finance and operations leaders, MRR optimism has now fallen four consecutive surveys while the do-not-know share climbs. For security teams, receivables opacity is a standing invitation to invoice fraud and business email compromise. For governance professionals, the new revenue-scale question, which nearly half of respondents declined, maps the limits of self-reported industry data.
Watch whether the 2H 2026 edition breaks the pattern. If visibility keeps eroding while confidence holds, the industry is budgeting on sentiment and hoping the receivables catch up.
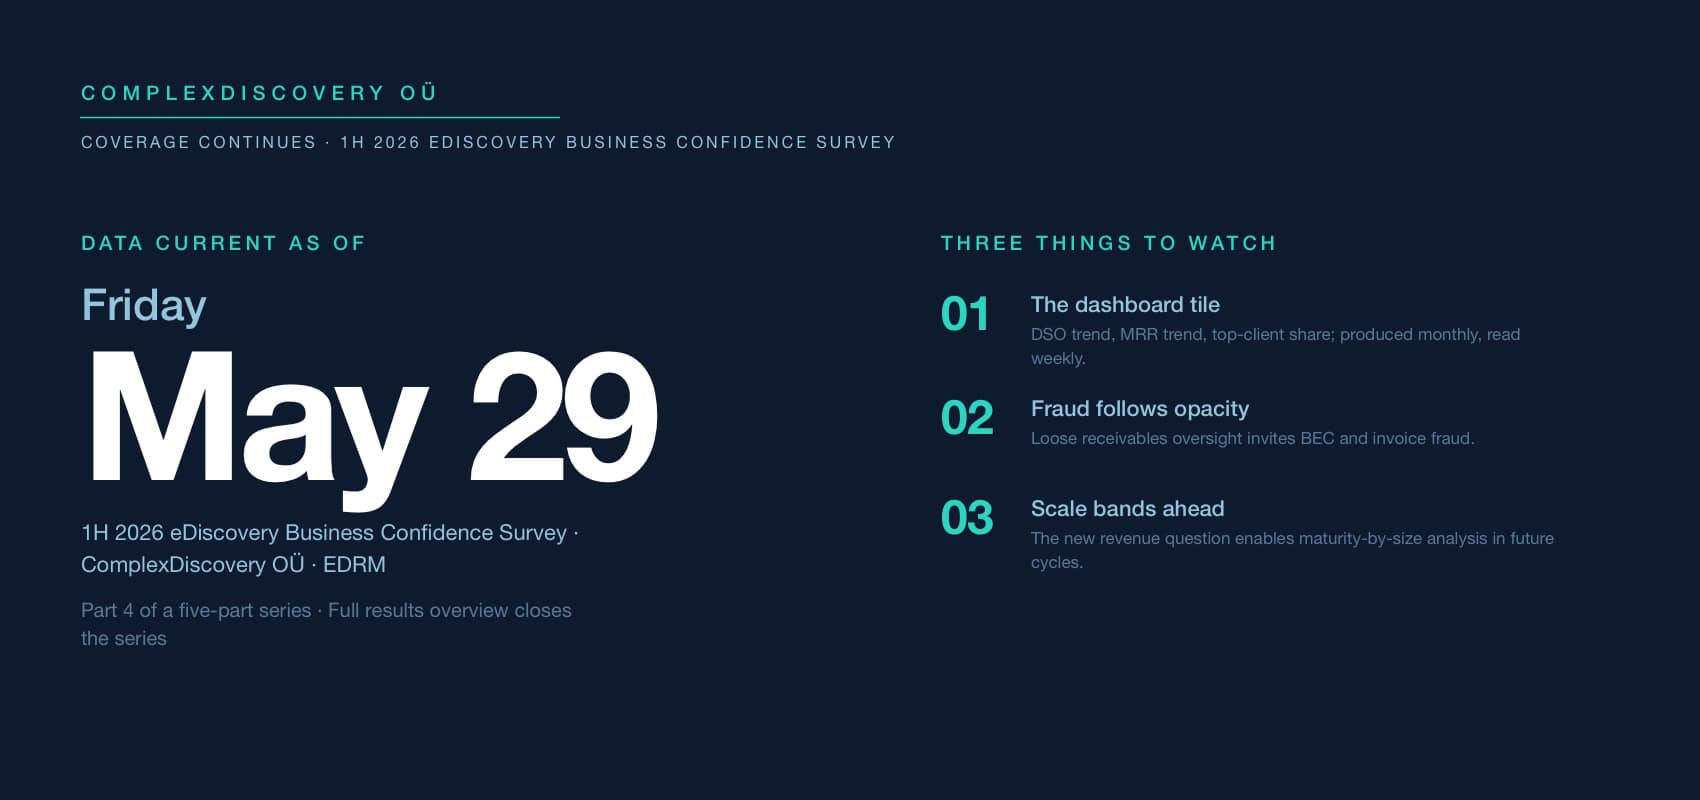
This report is Part 4 of a five-part series on the 1H 2026 eDiscovery Business Confidence Survey; a complete-look overview of the full results closes the series.
Content Assessment: Paid slower, tracked less: operational metrics in the 1H 2026 eDiscovery Business Confidence Survey
Information - 93%
Insight - 92%
Relevance - 90%
Objectivity - 93%
Authority - 94%
92%
Excellent
A short percentage-based assessment of the qualitative benefit expressed as a percentage of positive reception of the recent article from ComplexDiscovery OÜ titled, "Paid slower, tracked less: operational metrics in the 1H 2026 eDiscovery Business Confidence Survey."
Industry Research Beat
Paid slower, tracked less: operational metrics in the 1H 2026 eDiscovery Business Confidence Survey
ComplexDiscovery OÜ Staff
The eDiscovery industry can tell you exactly how it feels. It increasingly cannot tell you how it is paid.
Nearly 46 percent of respondents to the 1H 2026 eDiscovery Business Confidence Survey could not describe the trajectory of their organization’s Days Sales Outstanding (DSO), the weakest financial-visibility reading in the recent history of the series. Among those who could, reports of slowing payments outnumbered reports of accelerating payments 14 to one. The survey, conducted April 15 through May 29, 2026 by ComplexDiscovery OÜ in collaboration with EDRM, drew 49 respondents; 48 answered the operational-metric questions, and their answers extend a two-year erosion the series first labeled the visibility gap.
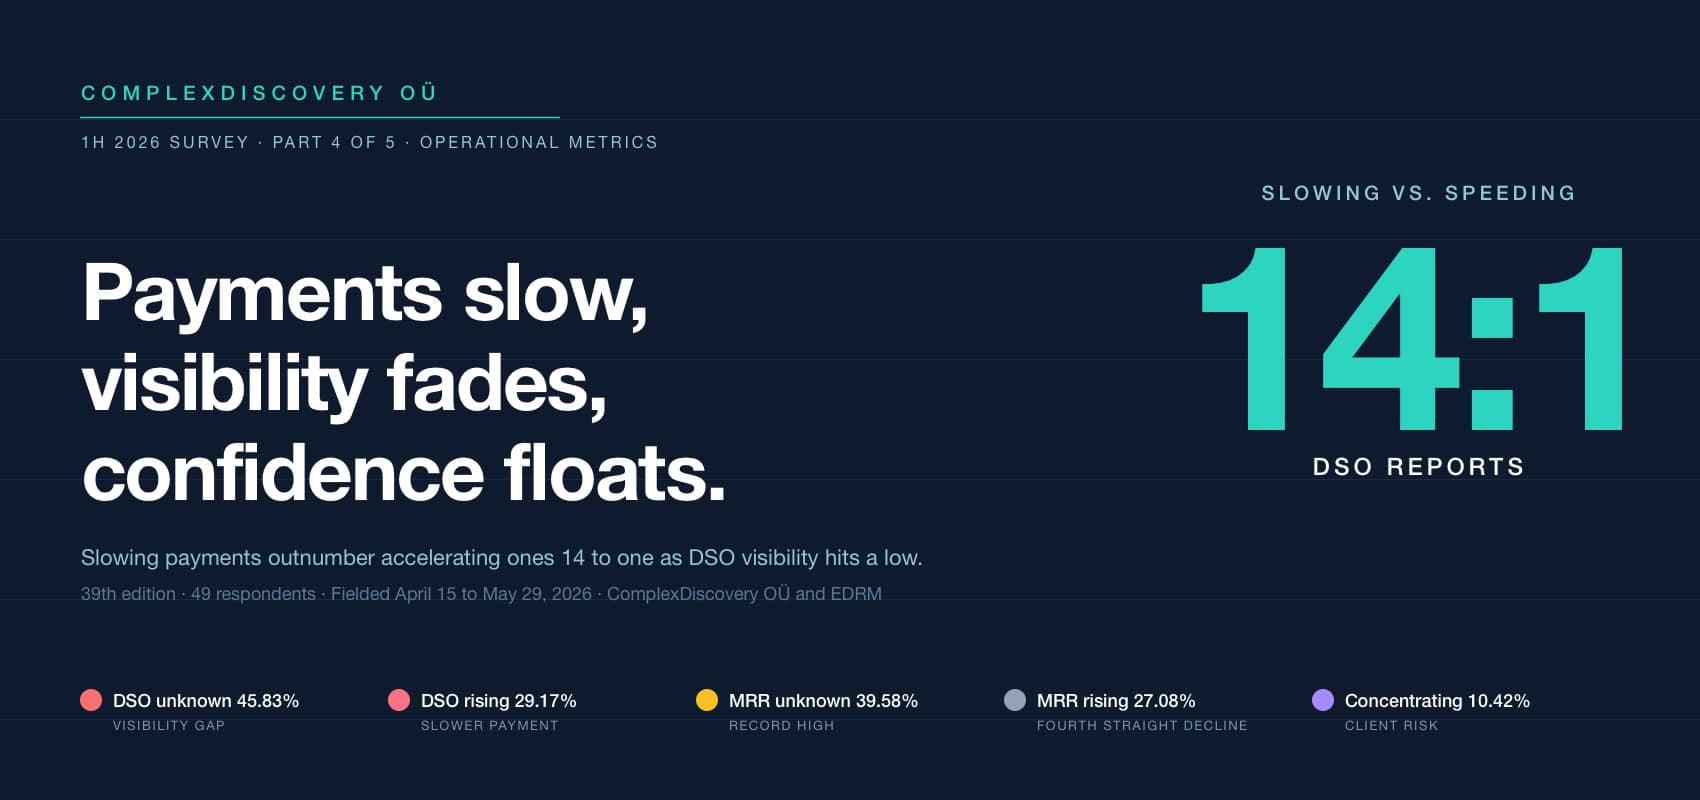
DSO: less visibility, worse direction
Of the 48 respondents answering the DSO question, 45.83 percent said they did not know the metric’s direction over the last six months, up from 33.90 percent in 2H 2025 and matching the pattern of 1H 2025, when the do-not-know share reached 44.29 percent. First-half surveys, which draw more tactical respondents, consistently show weaker financial visibility, and this cycle’s cross-tabulation confirms the gradient: 58 percent of tactical respondents did not know their DSO trajectory against 23 percent of executives. But the direction among informed respondents is what should hold attention: 29.17 percent reported DSO increasing, meaning slower payment, against 2.08 percent, a single respondent, reporting improvement. In 2H 2025 that ratio was 18.64 percent to 11.86 percent; in Fall 2024, 18.64 percent to 8.47 percent. The imbalance has never been this lopsided in the recent series.
The 2H 2025 analysis warned that unknown DSO trajectories were unacceptable in a high-interest-rate environment and flagged the risk of a liquidity squeeze arriving mid-boom. Six months later, the industry answered with less visibility and worse direction. Providers extending credit to law firm and corporate clients are, on this evidence, financing their customers’ matter cycles at growing cost, and many cannot see it happening.
eDiscovery Business Metric Trajectory_ Days Sales Outstanding 1H26
MRR: the anchor drags
Monthly Recurring Revenue (MRR), the metric the 2H 2025 series called the bedrock of industry confidence, weakened on both dimensions. The share reporting increasing MRR fell to 27.08 percent, the fourth consecutive decline from 54.24 percent in Fall 2024, 35.21 percent in 1H 2025, and 33.90 percent in 2H 2025. The do-not-know share, meanwhile, reached 39.58 percent, up from 25.42 percent in 2H 2025 and 29.58 percent in 1H 2025.
Stable-or-increasing MRR, the combined figure the 2H 2025 analysis celebrated at 69.49 percent, now stands at 52.08 percent. Subscription and managed-service models remain the industry’s buffer against lumpy litigation demand, but the buffer is thinning, and a growing share of leadership simply is not tracking it. Four respondents, 8.33 percent, reported declining MRR outright.
eDiscovery Business Metric Trajectory_ Monthly Recurring Revenue 1H26
Concentration: the untracked risk
Revenue distribution across customer bases completed the pattern. The do-not-know share hit 37.50 percent, up from 15.25 percent in Fall 2024 and 32.39 percent in 1H 2025. Among informed respondents, 29.17 percent described distribution as unfluctuating, 22.92 percent as increasingly spread, and 10.42 percent, five respondents, as concentrating into fewer clients, the highest concentration reading of the recent series’ published cells.
Concentration is the quiet killer in professional services: a provider that loses sight of how much revenue rides on its top three clients discovers the answer at contract renewal. With federal enforcement activity cooling and large investigations, the industry’s whales, less dependable, the 2H 2025 scenario planning around replacing one large matter with many smaller ones applies directly; smaller matters spread revenue but raise overhead, and only organizations tracking distribution will notice which effect is winning.
eDiscovery Business Metric Trajectory_ Distribution of Revenue Across Customer Base 1H26
Revenue scale: half the industry declines to say
The survey’s new annual-revenue question extended the opacity theme to scale itself. Asked the approximate annual revenue of their organization’s eDiscovery-related business, 48.98 percent of respondents chose do not know or prefer not to answer. Among the 25 who disclosed, 36 percent reported under $5 million, 24 percent between $5 million and $25 million, 16 percent between $25 million and $100 million, 16 percent between $100 million and $250 million, and 8 percent, two organizations, at $250 million or above.
The disclosure-willing skew small, as founders and consultants know their own numbers in ways enterprise employees often do not, or may not share. The question’s value compounds in future cycles, when confidence, AI maturity, and financial visibility can be compared across scale bands; for now it establishes that the survey reaches organizations from boutique to over $250 million.
Approximate Annual eDiscovery-Related Revenue 1H26
Closing the gap before it closes on you
The prescription has not changed since the series first identified the gap; the urgency has. Three metrics, DSO trajectory, MRR trajectory, and top-client revenue share, fit on a single dashboard tile and require no new software to track. Finance can produce them monthly; operational leaders should read them weekly when 29.17 percent of the industry reports payments slowing. The same visibility that protects liquidity also protects against business email compromise and invoice fraud, which thrive precisely where receivables oversight is loose, a point the 2H 2025 analysis made and this cycle’s numbers amplify.
The industry enters the second half of 2026 with steady revenue expectations, deepening AI deployment, and a financial dashboard that is going dark one metric at a time. Confidence and visibility are converging on a question the 2H 2026 survey will ask again this autumn: if conditions are normal and forecasts are firm, why do fewer leaders each cycle know how the money actually moves? What would your organization find if it pulled its DSO trend this afternoon?
News sources
- 1H 2026 eDiscovery Business Confidence Survey Launches With Expanded AI and Revenue Focus (ComplexDiscovery)
- The Shift from AI Pilots to Production: Insights from the 2H 2025 eDiscovery Business Confidence Survey (ComplexDiscovery)
- Confidence Meets Complexity: Full Results from the 2H 2025 eDiscovery Business Confidence Survey (ComplexDiscovery)
- 1H 2025 eDiscovery Business Confidence Survey Results Released by ComplexDiscovery OÜ and EDRM (ComplexDiscovery)
- Optimism and Innovation in eDiscovery: Fall 2024 Business Confidence Survey Insights (ComplexDiscovery)
- EDRM: Empowering the Global Leaders of eDiscovery (EDRM)
- Steady money, softer mood: financial outlooks in the 1H 2026 eDiscovery Business Confidence Survey (ComplexDiscovery)
- Data diversity takes the top seat: impact issues in the 1H 2026 eDiscovery Business Confidence Survey (ComplexDiscovery)
- From deployment to discipline: AI and governance in the 1H 2026 eDiscovery Business Confidence Survey (ComplexDiscovery)

Assisted by GAI and LLM Technologies
Additional reading
- Complete look: ComplexDiscovery OÜ’s 2025 to 2030 eDiscovery market size mashup
- The workstream of eDiscovery: Considering processes and tasks
- Andrew Haslam’s eDisclosure Systems Buyers Guide at 14: What the 1H 2026 update reveals
- A Complete Analysis of the Winter 2026 eDiscovery Pricing Survey
- The M&A Risk of Confusing Market Velocity with Marketing Capability
Source: ComplexDiscovery OÜ

ComplexDiscovery’s mission is to enable clarity for complex decisions by providing independent, data‑driven reporting, research, and commentary that make digital risk, legal technology, and regulatory change more understandable for practitioners, policymakers, and business leaders.